ROI【🔒Classified File】 No. X040 | What is NPS
📅 2025-10-20
🕒 Reading time: 27 min
🏷️ NPS 🏷️ Learning 🏷️ 【🔒Classified File】
- What is NPS - Case Overview
- Basic Structure of NPS - Evidence Analysis
- NPS Implementation Procedures - Investigation Methods
- Power of NPS - Hidden Truth
- NPS Limitations and Cautions - Potential Dangers
- NPS Applications and Related Methods - Related Case Files
- Industry-Specific NPS Use Cases - Special Evidence
- NPS vs Other Customer Metrics - Comparative Analysis
- Practical NPS Implementation Techniques - Practical Guide
- NPS Integration into Organizational Culture - Special Measures
- Future and Evolution of NPS - Prospect Analysis
- Conclusion - Investigation Summary

Detective's Memo: The revolutionary customer loyalty measurement method "NPS (Net Promoter Score)" published by Fred Reichheld in 2003. Many misunderstand it as merely a "0-10 point survey," but its true identity is a "leading indicator system that predicts revenue growth from behavioral predictions of recommendation intent." Why did Apple, Amazon, and Tesla abolish complex satisfaction surveys and focus solely on NPS? And why can a single question "How likely are you to recommend to friends/colleagues?" predict a company's future revenue? The quantification of word-of-mouth free marketing created by the three-way classification of Detractors (0-6 points), Passives (7-8 points), and Promoters (9-10 points). Uncover the true identity of this ultimate customer-centric management indicator that measures future behavior of recommendation rather than past emotions of satisfaction.
What is NPS - Case Overview
NPS (Net Promoter Score), formally known as the "Growth Prediction Indicator Based on Customer Recommendation Intent," is a customer loyalty measurement theory published by Fred Reichheld of Bain & Company in a 2003 Harvard Business Review paper. Using a single question "How likely are you to recommend this company/product/service to friends or colleagues? (0-10 points)," it classifies customers into Promoters (9-10 points), Passives (7-8 points), and Detractors (0-6 points), and is recognized among clients as a score (-100 to +100) calculated as "Promoter percentage - Detractor percentage." However, in actual practice, it is often superficially understood as a "simple survey," with most companies failing to understand its original strategic value: that recommendation intent predicts word-of-mouth and referrals as free marketing and strongly correlates with revenue growth rates.
Investigation Memo: NPS is not merely a "satisfaction indicator" but a "growth engine health check." Why are satisfied customers (7-8 points) ignored as "passives," and why does a 2-point difference between recommendation intent (10 points) and satisfaction (8 points) create a decisive difference in business growth? We need to clarify this modern business growth prediction foundation that converts the Happiness dimension of the HEART Framework into a single indicator and quantitatively measures the Referral of AARRR.
Basic Structure of NPS - Evidence Analysis
Basic Evidence: Customer Classification and Growth Prediction Through One Question
The Ultimate Question
NPS Measurement Single Question:
"How likely are you to recommend [Company Name/Product Name/Service Name] to a friend or colleague?"
0 - 1 - 2 - 3 - 4 - 5 - 6 - 7 - 8 - 9 - 10 Not at all likely Neutral Extremely likely
Why This Question is Revolutionary:
Problems with Traditional Satisfaction Surveys: - Many questions (20-50) - High response burden → Lower response rates - Complex results → No actionable insights - Satisfaction ≠ Repurchase/Recommendation
NPS Innovation: - Only one question → High response rate - Recommendation intent = Behavioral prediction - Clear classification → Immediate action guidelines - Proven correlation with growth rates
Three Customer Classifications
Detractors: 0-6 points
Characteristics: - Dissatisfied customers - Spread negative word-of-mouth - High churn (cancellation/departure) risk - Cause of brand damage
Behavioral Patterns: - Post critical reviews on SNS/review sites - Convey negative evaluations to friends/colleagues - Consider switching to competitors - Frequent complaints to customer support
Business Impact: - Hinder new customer acquisition (-1 person spreads bad reputation to 5-10 people) - Decline in brand image - Revenue loss from cancellations - Increased support costs
Response Priority: Highest (damage control/improvement)
Passives: 7-8 points
Characteristics: - Satisfied but not enthusiastic - Passive customers - Switch with attractive competitor offers - Rarely do word-of-mouth/recommendations
Behavioral Patterns: - No particular dissatisfaction but no special attachment - Switch if better alternatives exist - "Neither good nor bad" evaluation - No active recommendations or criticisms
Business Impact: - Zero contribution to growth - Stable but fragile revenue source - Risk of capture by competitors - No new acquisition through recommendations
Response Priority: Medium (elevation to promoters)
Important Insight: Satisfaction (7-8 points) ≠ Loyalty "Somewhat satisfied" is insufficient for growth
Promoters: 9-10 points
Characteristics: - Enthusiastic fans - Active word-of-mouth/recommendations - High repeat purchase rate - Brand Ambassadors
Behavioral Patterns: - Actively recommend to friends/colleagues - Post/share positively on SNS - Write high ratings on review sites - Early adoption of new products/features
Business Impact: - Free marketing (word-of-mouth/referrals) - Reduced Customer Acquisition Cost (CAC) - High LTV (Customer Lifetime Value) - Enhanced brand value
Response Priority: High (maintain/further delight)
NPS Calculation Formula
Basic Calculation:
NPS = Promoter Percentage (%) - Detractor Percentage (%)
Example: 100 respondents - Promoters (9-10 points): 60 people → 60% - Passives (7-8 points): 20 people → 20% (not included in calculation) - Detractors (0-6 points): 20 people → 20%
NPS = 60% - 20% = +40
Score Range:
Minimum: -100 (all detractors) Maximum: +100 (all promoters) Neutral: 0 (promoters = detractors)
Actual Distribution: -100 to 0: Critical situation (urgent improvement) 0 to 30: Much room for improvement (below industry average) 30 to 50: Good (industry average level) 50 to 70: Excellent (industry top class) 70 to 100: Outstanding (world-class standard)
Industry Benchmarks (Reference Values):
Software/SaaS: 30-40 E-commerce: 40-50 Financial Services: 20-40 Telecom Carriers: 0-30 Airlines: 10-40 Hospitality: 40-60 Automotive: 30-50
Why Ignore Passives (7-8 points)?
Counter-intuitive but Rational Design:
Traditional Thinking: "7-8 points means satisfied customers, aren't they good?"
NPS Insight: "Satisfaction ≠ Recommendation/Growth Contribution"
Empirical Data: - 7-8 point customers' recommendation behavior: Nearly zero - 9-10 point customers' recommendation behavior: Frequent - Non-linear relationship between satisfaction and loyalty
Growth Contribution: - Promoters: +1 (new customer acquisition) - Passives: 0 (status quo only) - Detractors: -1 (customer loss/bad reputation)
Therefore: NPS = Growth Contributors (+1) - Growth Inhibitors (-1)
Evidence Analysis: The innovation of NPS lies in quantifying the impact of customer experience on revenue growth by measuring "recommendation intent" as future behavior rather than "satisfaction" as past emotion.
NPS Implementation Procedures - Investigation Methods
Investigation Finding 1: Apple Retail Store Practice Case
Case Evidence (World's Highest NPS: 72 Secret):
Phase 1: NPS Implementation Decision (2007)
Background: - Customer experience revolution after Steve Jobs' return - Apple Store launch - Doubts about complexity of "customer satisfaction surveys"
Decision: "Abolish complex surveys and focus solely on NPS"
Reasons: - Simplicity = Focus on essence - Recommendation intent = True loyalty measurement - Clarity that all staff can understand and act on
Phase 2: Measurement System Construction (2007-2008)
Implementation Method:
After Store Visit: - Automatic email/SMS sending (within 24 hours of visit) - NPS question (0-10 points) - Free text field ("Why that score?")
After Genius Bar Use: - Question immediately after service completion - Instant response on tablet - Real-time aggregation
Online Store: - Email after purchase completion - Follow-up after delivery completion - Regular customer surveys
Response Rate Improvement Measures: - Only one question = Minimum burden - Timing optimization (right after experience) - Mobile optimization (easy smartphone response)
Phase 3: Organizational Utilization (2008-Present)
Company-wide KPI: - Weekly review at CEO/executive level - Store/region/product-specific NPS measurement - Reflection in employee evaluation
Store-Level Utilization:
Daily Morning Meeting: - Share previous day's NPS results - Review all detractors' (0-6 points) voices together - Immediate decision on improvement actions
Weekly Meeting: - Analyze NPS trends - Share specific comments from promoters/detractors - Horizontal deployment of best practices
Detractor Follow-up: - Contact 0-6 point respondents within 24 hours - Detailed hearing of problems - Immediate problem resolution/compensation - Re-survey after improvement
Promoter Utilization: - Thank 9-10 point customers - Request review posts - Introduce referral program - Invite to new product beta versions
Phase 4: Continuous Improvement (2008-Present)
Problem Example Discovered (2010):
NPS: 68 → 62 (6-point decline)
Detractor Voice Analysis: - "Wait time too long" (32%) - "Staff lacks product knowledge" (28%) - "Too crowded, not calm" (21%)
Improvement Measures:
Wait Time Issue: - Improved Genius Bar reservation system - Increased staff (during peak hours) - Expanded "Today at Apple" sessions (distribution)
Product Knowledge Issue: - Enhanced staff training - Intensive training before new product launches - Placement of product specialists
Crowding Issue: - Store expansion/new stores - Encourage online reservations - Real-time display of crowding status
Results (6 months later): - NPS: 62 → 72 (+10 points) - Wait time: Average 45 minutes → 15 minutes - Customer satisfaction: Rapid increase - Sales growth: +18% acceleration
Phase 5: Performance Measurement (2007-2023)
Quantitative Results:
NPS Transition: - 2007: 58 - 2010: 68 - 2015: 72 - 2023: 72 (maintained)
Business Impact: - Store sales/㎡: 5 times industry average - Customer Lifetime Value (LTV): +300% improvement - New customers via word-of-mouth: 40% of total - Brand value: World #1
Qualitative Results: - "Apple Store experience" itself is brand value - Differentiation factor competitors cannot imitate - Improved employee engagement - Industry benchmark
Investigation Finding 2: Implementation at B2B SaaS Startup
Case Evidence (Building NPS from Zero - 6 Months):
Phase 1: NPS Design (1 Month)
Goal Setting: - Quantitative measurement of customer loyalty - Early prediction of churn (cancellation) - Product improvement prioritization
Measurement Timing Decision:
Relationship NPS (rNPS): - Quarterly regular surveys - Send to all customers - Understand long-term trends
Transactional NPS (tNPS): - After important touchpoints - After onboarding completion - After support inquiry resolution - After new feature release - At contract renewal - Evaluation of specific experiences
Question Design:
Main Question: "How likely are you to recommend [Product Name] to a friend/colleague in [Job Role]?"
Follow-up Questions: - "Please tell us why you gave that score" - "What would you most like us to improve?" - "What do you like most?"
Phase 2: Measurement Infrastructure Construction (1 Month)
Tool Selection/Implementation:
NPS Survey Tool: - Delighted (Selection reason: Simple/Automated) - Alternatives: SurveyMonkey, Typeform
Integration: - CRM (Salesforce) integration - Customer Success tool (Gainsight) integration - Automatic Slack notifications
Automation Settings:
Triggers: - 14 days after onboarding → Automatic sending - Support ticket close → Send 1 hour later - First day of quarter → Send to all customers
Response Rate Improvement Measures: - Email subject optimization (A/B testing) - Send time optimization (Tue-Thu 10-14:00) - Mobile optimization - Reminders (after 3 days, 7 days)
Phase 3: Baseline Measurement (1 Month)
Initial Survey Implementation:
Target: All 120 customers Response Rate: 42% (50 companies)
Results: - Promoters (9-10 points): 16 companies (32%) - Passives (7-8 points): 20 companies (40%) - Detractors (0-6 points): 14 companies (28%)
NPS = 32% - 28% = +4
Evaluation: Low compared to industry average (SaaS: 30-40)
Detractor (0-6 points) Voices:
Most Common Reasons (Qualitative Analysis): 1. "Features too complex to master" (35%) 2. "Support response too slow" (29%) 3. "Not achieving expected results" (21%) 4. "Price too high" (15%)
Promoter (9-10 points) Voices:
High Rating Reasons: 1. "Dramatically more efficient than previous tools" (41%) 2. "UI intuitive and easy to use" (32%) 3. "Support very helpful and caring" (27%)
Phase 4: Improvement Implementation (3 Months)
Prioritization:
Detractor → Promoter Conversion Potential: - Feature complexity: High (immediate effect with improvement) - Support delay: High (resolved with system enhancement) - Lack of results: Medium (customer success enhancement) - Price issue: Low (value perception comes first)
Sprint 1-2: Feature/UI Improvement
Measures: - Redesigned onboarding flow - Created tutorial videos (20 videos) - "Recommended usage" guide - UI simplification (clicks -40%)
Results (2 months later): - "Cannot master" complaints: -65% reduction - Onboarding completion rate: 58% → 82% - First month active rate: +28% improvement
Sprint 3-4: Support System Enhancement
Measures: - Added 2 support staff - Average response time target: 24 hours → 4 hours - Expanded FAQ/Help Center - Introduced chatbot (simple question handling)
Results (2 months later): - Average response time: 18 hours → 3.2 hours - First contact resolution rate: 62% → 84% - Support satisfaction: +42% improvement
Sprint 5-6: Customer Success Enhancement
Measures: - Quarterly business reviews for all customers - Provided ROI visualization reports - Best practice sharing webinars - Regular introduction of success stories
Results (3 months later): - Customers "feeling results": 45% → 73% - Feature utilization rate: +38% improvement - Contract renewal rate: 82% → 94%
Phase 5: Continuous Measurement/Improvement (Ongoing)
Results After 6 Months:
NPS Transition: - Start: +4 - 3 months later: +18 - 6 months later: +32
Segment Analysis:
Promoters: 32% → 52% (+20pt) Passives: 40% → 32% (-8pt) Detractors: 28% → 16% (-12pt)
Business Impact:
Churn rate: 9% → 4%/quarter Upsell rate: 12% → 24% CAC recovery period: 14 months → 9 months New via word-of-mouth: 8% → 22% ARR growth rate: +15% → +38%/year
Investigation Finding 3: NPS Follow-up Practice
Closed-Loop Process:
Detractor (0-6 points) Follow-up:
- Immediate Contact (Within 24 Hours):
- Call/email from Customer Success
-
"We'd like to hear your voice"
-
Detailed Problem Hearing:
- Specific dissatisfaction points
- Gap with expectations
-
What to improve
-
Immediate Response:
- Solvable problems → Execute immediately
- Mid-term issues → Share roadmap
-
Structural problems → Explain improvement plan
-
Follow-up:
- Confirmation contact after response
- Re-survey NPS (1-2 months later)
- Make them feel improvement
Effect: - Detractor → Promoter conversion: 35% - Detractor → Passive conversion: 45% - Churn prevention: 65%
Passive (7-8 points) Follow-up:
- Segment Analysis:
- Why not 9-10 points?
-
What is missing?
-
Additional Value Provision:
- Introduction/training on advanced features
- Share success stories from other companies
-
Propose ROI maximization
-
Engagement Enhancement:
- Community event invitations
- Beta version/early access to new features
- VIP treatment/benefits
Effect: - Passive → Promoter conversion: 28% - Upsell rate: +35% improvement - LTV: +22% improvement
Promoter (9-10 points) Utilization:
- Thanks/Recognition:
- Thank you email/call
- Special offers/gifts
-
Request for success story introduction
-
Advocacy Program:
- Request review posts
- Referral introduction program
-
Case study cooperation
-
Co-creation:
- User community management
- Seek opinions on product improvement
- Beta tester invitation
Effect: - New via word-of-mouth: 22% of total - CAC: -35% reduction - Brand value: Significant improvement
Power of NPS - Hidden Truth
Warning File 1: Strong Correlation with Growth Rate
Fred Reichheld's research has proven a strong correlation between NPS and corporate growth rates. Within the same industry, companies with higher NPS have higher revenue growth rates, and data shows that when NPS exceeds the industry average by 10 points, the growth rate doubles.
Warning File 2: Quantification of Word-of-Mouth Free Marketing
Quantitatively measures the word-of-mouth effect where one promoter recommends to an average of 4-5 people, of which 1-2 actually make purchases. Enables new acquisition with zero CAC (Customer Acquisition Cost), dramatically improving marketing efficiency.
Warning File 3: Early Prediction of Churn (Cancellation)
NPS decline is a powerful leading indicator of churn. Detractors' (0-6 points) churn rate is more than 10 times that of promoters. NPS monitoring enables problem discovery and countermeasures before cancellation.
Warning File 4: Fostering Customer-Centric Culture Throughout Organization
A simple single indicator allows all employees (CEO to frontline) to share the same goal. Unlike complex satisfaction surveys, the clarity that everyone can understand and act on realizes organizational culture transformation.
NPS Limitations and Cautions - Potential Dangers
Warning File 1: Response Bias Due to Culture/Language
The greatest danger. In Asian cultures like Japan, there is strong psychological resistance to giving "10 points," tending toward lower scores compared to Western cultures. Cultural adjustment is essential for international comparisons/benchmarks.
Warning File 2: Differences in Baseline Values by Industry/Product Type
Cannot compare telecom carriers (NPS: 0-30) and luxury hotels (NPS: 50-70) on equal terms. Comparison with industry benchmarks is important, but emerging industries lack benchmark data.
Warning File 3: Score Improvement Becomes End in Itself
Risk of forgetting true customer value creation as "NPS improvement" itself becomes the goal. Temptation to manipulate scores through improper means such as providing rewards/threats to respondents. Danger of falling into measurement for measurement's sake.
Warning File 4: Excessive Dependence on Single Indicator
NPS alone doesn't clarify "why" that score. Combination with free text fields/qualitative research is essential. Integration with other indicators like HEART Framework is important.
Warning File 5: Long-term Value Destruction Through Short-term Manipulation
Excessive discounts/benefits to raise NPS in short term → Profitability deterioration. Risk of rushing to superficial symptomatic treatment rather than fundamental product/service improvement.
NPS Applications and Related Methods - Related Case Files
Related Evidence 1: Integration with HEART Framework
Happiness × NPS: - Use NPS as main indicator of HEART's Happiness dimension - Multi-dimensional measurement with NPS + other HEART indicators - Integrated analysis of recommendation intent (NPS) + usage frequency (Engagement)
Integration Effect: Understanding both satisfaction and behavior
Related Evidence 2: Collaboration with AARRR Pirate Metrics
Referral × NPS: - Quantitatively measure AARRR's "Referral" with NPS - Promoter percentage → Prediction of word-of-mouth acquisition - NPS improvement → CAC reduction/growth loop acceleration
Retention × NPS: - NPS decline → Early churn prediction - Segment-specific NPS → Prioritization of retention measures
Integration Effect: Optimization of entire growth hacking
Related Evidence 3: Goal Setting with OKR
Goal Management × NPS: Objective: Improve customer loyalty Key Results: - Achieve NPS +50 or higher - Promoter percentage 60% or higher - Detractor percentage 10% or lower - Detractor→Promoter conversion rate 30% or higher
Quarterly NPS goal setting/achievement evaluation Organizational pursuit of NPS through OKR
Related Evidence 4: Measurement in Customer Journey
Customer Journey × NPS: - NPS measurement at each touchpoint - After first purchase - After onboarding completion - After support use - At contract renewal - Visualization of NPS trends throughout journey - Bottleneck discovery/improvement
Integration Effect: Time-series experience improvement
Related Evidence 5: Continuous Improvement with RCD Model
Learning System × NPS: - Record: Record NPS results/customer voices - Check: Score changes/trend analysis - Do: Improvement execution based on priorities
Implement NPS continuous improvement with RCD cycle
Industry-Specific NPS Use Cases - Special Evidence
Related Evidence 6: Tesla (Automotive)
NPS: 96-97 (Highest in automotive industry)
Revolutionary Approach:
- Thorough Pursuit of Product Experience:
- Acceleration performance/quietness/autonomous driving
- OTA (Over-The-Air) updates
-
Continuous feature additions/improvements
-
Sales Process Innovation:
- Dealer abolishment → Direct sales
- No price negotiation → Transparency
-
Easy test drive reservations
-
After-sales Service:
- Mobile service (repairs at home/workplace)
- Supercharger network
-
Community events
-
Brand/Mission:
- Sense of contributing to environmental issues
- Sense of participating in innovation
- Strong owner community
Results: - Promoter percentage: 97% (almost everyone) - Word-of-mouth purchases: Estimated 60%+ - Marketing expenses: Nearly zero - Brand value: Rapid rise
Related Evidence 7: Amazon (E-commerce)
NPS: 62 (Top class in e-commerce industry)
NPS-Driven Mechanism:
- Customer Obsession:
- First of 14 Leadership Principles
-
Standard for all decision-making
-
Prime Member Experience:
- Free/fast shipping
- Added value like Prime Video/Music
-
Overwhelming convenience
-
Customer Reviews:
- Transparency/trustworthiness
- Help with purchase decisions
-
Product improvement feedback
-
Customer Service:
- Speed of problem resolution
- Ease of returns/refunds
-
"Customer is right" culture
-
Continuous Innovation:
- 1-Click ordering
- Alexa/Echo
- Dash Button (at the time)
Measurement/Improvement: - Regular NPS surveys after purchase - Seller/category-specific NPS - Experience optimization through A/B testing
Results: - Prime members: 200 million+ - Member retention rate: 93% - Cross-sell/upsell success rate: High
Related Evidence 8: Netflix (Video Streaming)
NPS: 68 (Top in entertainment industry)
NPS Improvement Strategy:
- Content Recommendation Accuracy:
- Personalization from viewing history
- "What to watch next" suggestions
-
Satisfaction improvement → NPS improvement
-
User Experience:
- Seamless viewing start
- Device synchronization
-
Offline viewing support
-
Original Content:
- Investment in exclusive works
- Diverse genres/languages
-
Production decisions based on viewing data
-
Pricing:
- Clear/simple plans
- Pricing commensurate with value
-
Ease of sharing
-
Customer Service:
- 24/7 support
- Ease of cancellation (customer trust)
- Low barrier to rejoining
Measurement: - Regular NPS surveys after viewing completion - Content category-specific NPS - Device/regional analysis
Results: - Subscribers: 250 million+ - Churn rate: Industry lowest level - Word-of-mouth effect: High new acquisition
NPS vs Other Customer Metrics - Comparative Analysis
Related Evidence 9: Difference from Customer Satisfaction (CSAT)
CSAT (Customer Satisfaction Score): Question: "Were you satisfied with this service?" Response: 1-5 points or Very dissatisfied to Very satisfied
Characteristics: - Evaluation of specific transaction/experience - Measurement of past emotion - Timely/specific - However, weak correlation with future behavior
NPS: Question: "Likelihood to recommend?" Response: 0-10 points
Characteristics: - Evaluation of overall relationship - Prediction of future behavior - Strong correlation with growth rate - However, difficult to identify individual problems
Usage: CSAT: Individual experience improvement (support quality, etc.) NPS: Long-term loyalty/growth prediction
Integrated Use: Comprehensive measurement with both indicators
Related Evidence 10: Difference from CES (Customer Effort Score)
CES (Customer Effort Score): Question: "How much effort was required to solve the problem?" Response: Very easy to Very difficult
Characteristics: - Measurement of task completion ease - Direct evaluation of usability - Clear improvement points - However, emotional loyalty outside measurement
NPS: Measurement of emotional connection/recommendation intent
Usage: CES: Task efficiency/usability improvement NPS: Overall loyalty/delightful experience
Example: Banking app: - CES: Ease of money transfer task - NPS: Recommendation intent for bank overall
Related Evidence 11: Relationship with LTV (Customer Lifetime Value)
NPS → LTV Causal Relationship:
Promoters (9-10 points): - High repeat purchase rate - High upsell/cross-sell success rate - Low churn rate - LTV: Highest
Passives (7-8 points): - Standard purchasing behavior - Medium competitor switching risk - LTV: Average
Detractors (0-6 points): - Early cancellation/departure - Spread negative word-of-mouth - LTV: Lowest (actually negative)
Empirical Data: Promoter LTV = Detractor LTV × 10-20 times
LTV Maximization Strategy: NPS improvement → Promoter percentage increase → Overall LTV improvement
Practical NPS Implementation Techniques - Practical Guide
Related Evidence 12: Science of Response Rate Improvement
Industry Average Response Rate: 10-30% Excellent Company Response Rate: 40-60%
Response Rate Improvement Measures:
- Timing Optimization: Best:
- Right after transaction/experience (within 24 hours)
- When positive emotions remain
- Tue-Thu 10-14:00 (B2B)
- Tue-Thu 19-21:00 (B2C)
Avoid: - Weekends/early Monday morning - Late night/early morning - After time has passed since experience
- Message Optimization: Subject line: Good example: "[Name], may we have 1 minute of your time?" Bad example: "Please cooperate with our survey"
Body: - Personalization (name/specific experience) - State time required ("1 minute") - Explain value of response (used for improvement) - Mobile optimization (easy on smartphone)
- Incentive Design: Effective:
- Lottery (Amazon gift cards, etc.)
- Next purchase discount (small amount still effective)
- Donation ($1 donation per response, etc.)
Caution: - Excessive incentives → Response bias - Rewards only to promoters → Induces fraud
- Multi-channel:
- Email (mainstream)
- SMS (high open rate)
- In-app notifications
-
Website pop-ups
-
Reminders:
- After 3 days: 1st reminder
- After 7 days: Final reminder
- No more sending after (avoid annoyance)
Implementation Example: - Email sending: 24 hours after experience - Reminder 1: To non-responders after 3 days - Reminder 2: To non-responders after 7 days - Total response rate: Achieved 45%
Related Evidence 13: Segment Analysis Practice
Why Overall NPS Alone is Insufficient:
Example: Overall NPS = +30
Segment Analysis: - New customers: +10 (improvement needed) - Existing customers: +50 (excellent) - Paid plan: +60 (most excellent) - Free plan: +5 (major issue)
→ Discover problems invisible in overall average
Recommended Segment Axes:
Customer Attributes: - New vs Existing - Free vs Paid - Company size (B2B) - Industry (B2B) - Age/gender (B2C) - Region
Behavioral Data: - Usage frequency (Heavy/Light) - Feature usage status - Support usage presence - Purchase amount
Customer Journey: - During onboarding - Active usage - Dormant - Considering cancellation
Implementation: CRM/data warehouse integration Create segment-specific dashboard Regular segment analysis reports
Related Evidence 14: AI Utilization for Free Text Analysis
Challenge: NPS numbers alone don't clarify "why" Manual analysis of free text takes time
Solution: AI/NLP (Natural Language Processing) Utilization
- Text Mining: Tools:
- MonkeyLearn
- Lexalytics
- Google Cloud Natural Language API
Implementation: - Automatically classify free text - Positive/negative - By topic (features/price/support, etc.) - Extract frequent keywords - Sentiment analysis
- Topic Modeling: Technology: LDA (Latent Dirichlet Allocation)
Discovery Example: Main Topics of Detractors (0-6 points): - Topic 1: "support slow response" (28%) - Topic 2: "features complex hard to understand" (24%) - Topic 3: "price high cost-effectiveness" (18%)
→ Clear improvement priorities
- GPT Utilization: Implementation:
- Request GPT-4 to summarize free text
- Extract common patterns/insights
- Generate action items
Prompt Example: "Analyze the following 100 NPS detractor comments and provide the top 3 main complaints and improvement suggestions"
Effect: - Analysis time: Days → Minutes - Insight quality: Improved - Oversight risk: Reduced
NPS Integration into Organizational Culture - Special Measures
Related Evidence 15: Building NPS-Driven Organizations
Level 1: Executive Commitment
Essential Elements: - CEO declares NPS as most important KPI - Regular NPS review in board meetings - Budget/resource allocation for NPS improvement - Exemplary behavior of "customer first"
Apple Example: - Tim Cook reviews NPS weekly - All executives have NPS responsibility - "Customer experience" at center of all strategy
Level 2: Company-wide KPI Implementation
Implementation: - Incorporate NPS into all department KPIs - Product: Product-specific NPS - Marketing: NPS of acquired customers - Customer Success: NPS of assigned customers - Support: Post-support NPS - Sales: NPS of closed customers - Reflection in employee evaluation/compensation - Bonus/promotion criteria
Caution: - Temptation to manipulate - Short-term optimization trap - Management with balanced scorecard
Level 3: Frontline Penetration
Practice: - Share NPS results at daily morning meetings - Listen to detractors' voices together - Immediate action decision on improvements - Motivation improvement with promoters' voices
Zappos Example: - All call center staff conscious of NPS - "WOW experience" creation as evaluation standard - Culture of sharing customer delight episodes
Level 4: Transparency/Visualization
Implementation: - Company-wide dashboard with public NPS - Real-time updates - Department/team/individual NPS - Ranking/gamification
Effect: - Healthy competition - Autonomous improvement actions - Horizontal deployment of success stories - Accelerated organizational learning
Related Evidence 16: Establishing Closed-Loop Culture
Closed-Loop Process: Customer Feedback → Immediate Response → Report to Customer → Re-measurement
Elements for Cultural Establishment:
-
Speed Emphasis: Rule: Contact detractors within 24 hours Reason: Delayed timing halves effectiveness Implementation: Automatic alerts/assignee allocation
-
Empowerment: Traditional: Wait for manager approval → Delayed response NPS Culture: Frontline judgment for immediate response Example: Ritz-Carlton
- $2,000 discretionary budget for employees
-
Immediate customer problem resolution
-
Learning/Sharing: Mechanism:
- Case sharing in weekly meetings
- Both success and failure cases
- Documentation of best practices
-
Integration into new employee training
-
Thanks/Recognition: Response to Promoters:
- Thank you contact (handwritten letters, etc.)
- Provide benefits/gifts
- Request case study cooperation
- VIP community invitation
Effect: - Strengthened customer relationships - Further loyalty improvement - Advocacy promotion
Future and Evolution of NPS - Prospect Analysis
Related Evidence 17: Next-Generation NPS Methods
Real-time NPS: Current: Periodic surveys (quarterly, etc.) Future: Immediate measurement right after experience - Transaction completion time - Automatic questions via AI chatbot - Emotion AI (facial expression/voice analysis)
Predictive NPS: Current: Past measurement values Future: Prediction from behavioral data - NPS prediction with machine learning models - Early detection of decline risk - Proactive intervention
Personalized NPS: Current: Same questions for everyone Future: Individually optimized questions - Deep dive based on previous responses - Personalized follow-up questions - Deeper insights acquisition
Automated Improvement NPS: Current: Humans analyze/plan measures Future: AI automatically executes improvements - Detect NPS decline - Automatically analyze causes - Automatically execute optimal interventions - Verify effectiveness with A/B testing
Emotional NPS: Current: Numbers only Future: Simultaneous emotion measurement - Voice tone analysis - Facial recognition - Text sentiment - Richer understanding
Technology Foundation: - AI/Machine Learning - Emotion AI (Affectiva, etc.) - Real-time data processing - Predictive analytics platforms
Related Evidence 18: NPS 3.0 Era
NPS 1.0 (2003-2010): - Basic measurement/classification - Periodic surveys - Manual analysis/response
NPS 2.0 (2010-2020): - Digital tool utilization - Segment analysis - Closed-Loop process - Integration into organizational culture
NPS 3.0 (2020-Present): - AI/Machine Learning integration - Real-time measurement - Predictive analysis - Automated improvement
NPS 4.0 (Future): - Ecosystem-wide NPS - Trust assurance with blockchain - Integration with Web3 communities - Metaverse experience NPS measurement - Emotion/behavior/biometric data integration
Predicted Changes: - NPS becomes "real-time health diagnosis" - Customer experience prediction/optimization automated - Comprehensive loyalty measurement beyond NPS - Global/cross-cultural standardization
Conclusion - Investigation Summary
Investigator's Final Report:
NPS is "a revolutionary single indicator that predicts growth from customer recommendation intent." This theory published by Fred Reichheld in 2003 consolidates traditional complex satisfaction surveys into a single question and functions as a powerful framework that predicts corporate revenue growth rates through behavioral prediction of recommendation intent as future behavior.
What was most impressive in this investigation was the power of "just one question." The simple question "How likely are you to recommend to friends or colleagues?" can predict a company's future because recommendation intent strongly correlates with actual behaviors of word-of-mouth and referrals, becoming a growth engine as free marketing.
The scientific nature of the three-way classification of Promoters (9-10 points), Passives (7-8 points), and Detractors (0-6 points) was also an important discovery. The counter-intuitive design of ignoring satisfied Passives (7-8 points) as "not contributing to growth" is a rational judgment based on empirical data, showing the profound insight that "satisfaction ≠ loyalty."
Success cases of world-class companies like Apple (NPS: 72), Tesla (NPS: 96), and Amazon (NPS: 62) clearly prove NPS's practicality and effectiveness. By abolishing complex satisfaction surveys and focusing solely on NPS, the entire organization shares the same goal and customer-centric culture is fostered.
The importance of the Closed-Loop process (feedback → immediate response → report → re-measurement) was also confirmed as important practical knowledge. The empirical data that 35% of detractors convert to promoters through contact within 24 hours, problem resolution, and follow-up shows the value of integrating NPS not just as "measurement" but into "improvement actions."
Integration possibilities with other business frameworks were also confirmed. Utilization as the Happiness indicator of HEART Framework, Referral measurement of AARRR, specific KR setting in OKR - NPS functions as a foundation that clarifies the effectiveness measurement of other methods.
The 6-month practice case at a B2B SaaS startup also proves the theory's validity. NPS improvement from +4 to +32, churn rate reduction from 9% to 4%, ARR growth rate acceleration from +15% to +38% are proof that appropriate NPS utilization produces concrete business results.
However, at the same time, the risk of response bias due to culture/language emerged as an important warning. Psychological resistance to "10 points" in Asian cultures like Japan, difficulty in comparison with Western countries, is a challenge that internationally expanding companies inevitably face, and the need for cultural adjustment was recognized.
The risk of score improvement becoming an end in itself was also confirmed as a danger to overcome. The temptation to manipulate scores through improper means such as providing rewards/pressure, and the danger of forgetting true customer value creation, are pitfalls that NPS-implementing organizations must always be vigilant about.
The caution about excessive dependence on a single indicator was also recognized as a necessary limitation. NPS alone doesn't clarify "why," and combination with free text fields, qualitative research, and other indicators (HEART Framework, etc.) is essential.
Future evolution possibilities through integration with AI/machine learning were also confirmed. A future is visible where NPS evolves from "past measurement" to "future prediction/automatic optimization" through real-time measurement, predictive NPS, automatic improvement, emotion AI integration, etc.
The necessity of organizational culture transformation was also recognized as an important implementation condition. Through executive commitment, company-wide KPI implementation, frontline penetration, transparency/visualization, there is a need to foster a culture where NPS functions not just as a number but as the organization's behavioral principle.
The most important discovery is that NPS functions beyond a mere "satisfaction indicator" as a "system that fosters customer-centric management organizational culture." Through a simple single question, all employees can understand and empathize, and through clear classification of promoters/detractors, it leads to immediate action - this feasibility is why NPS became the world's most widespread customer indicator.
In the modern era where uncertainty, intensifying competition, and increasingly sophisticated customer expectations prevail, customers who are "somewhat satisfied" are insufficient. NPS presents a new paradigm of "increasing customers delighted enough to recommend," "utilizing word-of-mouth free marketing," and "building a sustainable growth engine," providing a revolutionary approach to customer-centric management.
Recommendation Maxim: "Satisfied customers say nothing, but delighted customers tell everyone. Growth comes from delight."
【ROI Detective Agency Classified File Series X040 Complete】
Case Closed
関連記事


📚 関連書籍
The SaaS Playbook: Build a Multimillion-Dollar Startup Without Venture Capital
🎖️ Top 3 Weekly Ranking of Classified Case Files
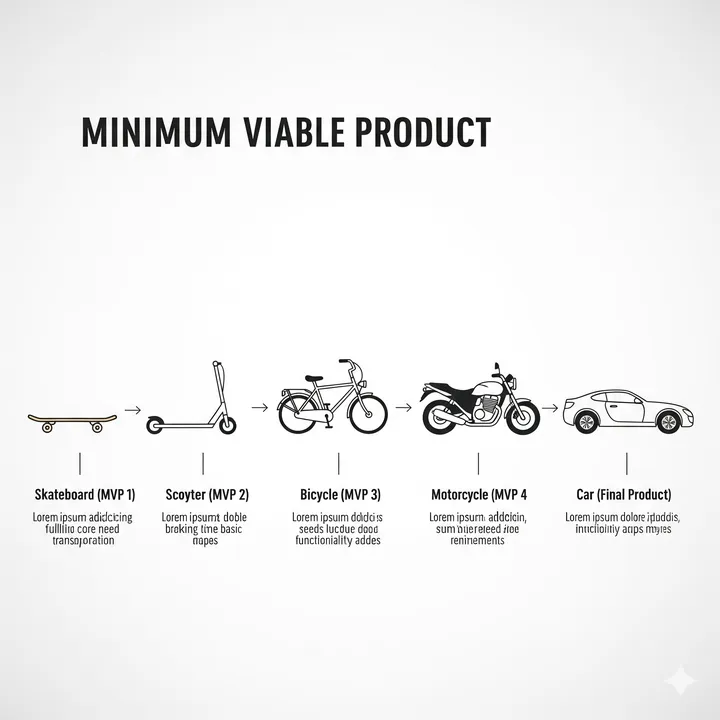
What is MVP
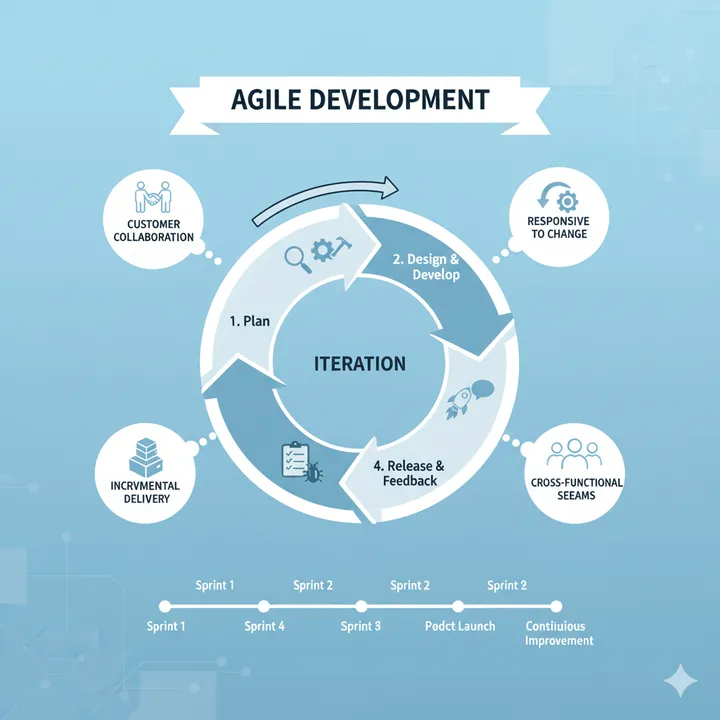
What is Agile Development
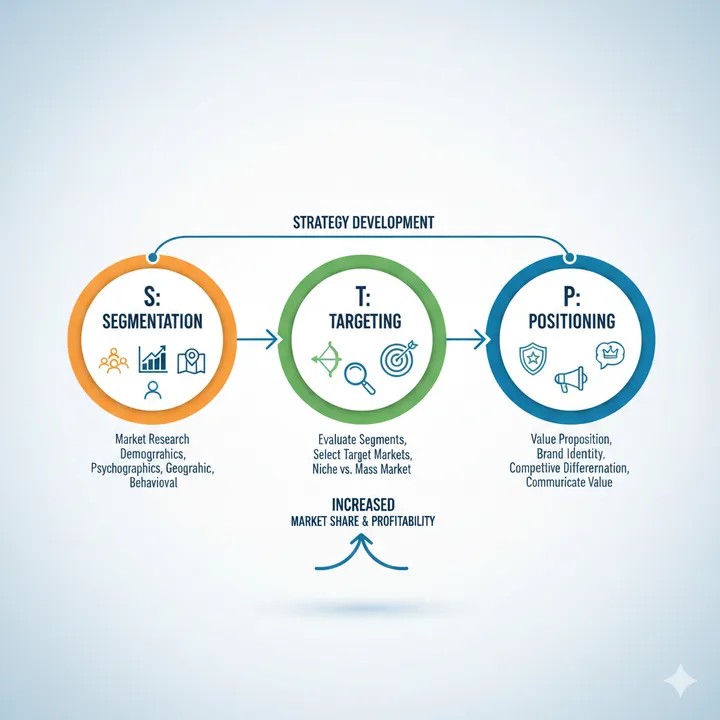
What is STP Analysis
Solve Your Business Challenges with Kindle Unlimited!
Access millions of books with unlimited reading.
Read the latest from ROI Detective Agency now!
*Free trial available for eligible customers only