ROI [🔏CLASSIFIED FILE] No. X045 | What is the Pareto Principle
📅 2025-11-11
🕒 Reading time: 11 min
🏷️ Pareto Principle 🏷️ Learning 🏷️ [🔏CLASSIFIED FILE]
- What is the Pareto Principle - Case Overview
- The Basic Structure of the Pareto Principle - Evidence Analysis
- Implementation Procedure of the Pareto Principle - Investigation Methods
- The Power of the Pareto Principle - Criminal Effects
- Limitations and Cautions of the Pareto Principle - Investigation Warnings
- Related Case Files - Additional Investigation Materials
- Industry-Specific Pareto Cases - Field Evidence
- Investigation Conclusion - Detective's Conclusion
Detective's Memo: In 1896, Italian economist Vilfredo Pareto discovered an astonishing law of inequality—the "Pareto Principle." While investigating land ownership in Italy, he uncovered a startling fact: 80% of the land was owned by merely 20% of the population. Few realized this "80:20" ratio was a universal law recurring across every domain. Why do 80% of a company's revenues come from 20% of its customers? Why are 80% of software bugs concentrated in 20% of modules? Why are 80% of results achieved in 20% of the time? While many remain trapped in the perfectionism of "spreading effort equally across everything," this law delivers a cold truth—the world is not equal, influence is unevenly distributed, and the successful are those who identify "the vital few." If the Realization First Principle preaches "realize first," the Pareto Principle teaches "what to realize." Decode this strategic thinking method of selection and concentration, woven by the mathematics of inequality.
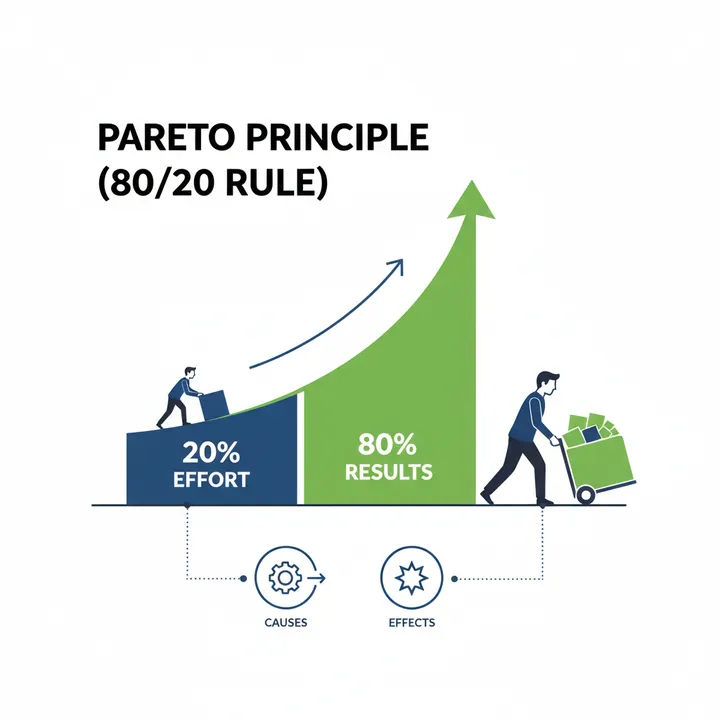
What is the Pareto Principle - Case Overview
The Pareto Principle, also known as the "80/20 Rule," is an empirical law of unequal distribution discovered in 1896 by Italian economist Vilfredo Pareto. It is recognized among our clients as the statistical tendency that "approximately 80% of all outcomes, outputs, or results are generated by approximately 20% of all constituent elements." However, in actual business settings, it's often trivialized as merely a "rough 80-20 guideline," with most organizations failing to grasp its true essence—the strategic value of optimizing resource allocation, the science of prioritization, and the exponential effects of concentration on the few.
Investigation Memo: The Pareto Principle isn't merely a "ratio guideline" but demonstrates the "universality of inequality." Why is this specific 80:20 ratio observed across diverse domains? The answer lies in the power law. In nature, society, and economics, many phenomena follow not normal distributions (bell curves) but power law distributions. Selecting "minimal features" in MVP, identifying "bottlenecks" in the Realization First Principle, prioritizing "value" in Agile Development—all are practical applications of this law.
The Basic Structure of the Pareto Principle - Evidence Analysis
Primary Evidence: Mathematical Patterns of Unequal Distribution
Core Structure of the Law
Core Proposition:
80% of outcomes = generated by 20% of elements
20% of outcomes = generated by 80% of elements

High-importance few >> Low-importance many
Mathematical Expression:
Y = Total outcomes/outputs
X = Total elements/inputs

80% of Y ← 20% of X
20% of Y ← 80% of X

Ratio: 20% of elements produce 80% of outcomes
Concentration factor: 4x efficiency difference (80/20 = 4)
Critical Findings:
The ratio isn't strictly 80:20 - Actually varies: 75:25, 90:10, 95:5, etc. - The essence is "unequal distribution" itself - Existence of "vital few" vs. "trivial many"
Contrast with equal distribution:
Equal distribution (theoretical ideal):
20% of elements → 20% of outcomes
80% of elements → 80% of outcomes

Pareto distribution (reality):
20% of elements → 80% of outcomes
80% of elements → 20% of outcomes
Visualizing Pareto Distribution
Cumulative Contribution Graph:
Outcomes
100% |                    ........
     |                ...
  80%|           ...   ← 20% of elements reach here
     |        ...
  60%|      ..
     |    ..
  40%|  ..
     | .
  20%|.
     |____________________
      20%  40%  60%  80% 100%
         Cumulative % of elements

Steep rise = high contribution from few
Gentle tail = low contribution from many
Relationship with Long Tail:
Pareto Distribution = Head + Long Tail

Head (20%):
- High frequency, high impact
- Concentrated value creation
- Strategic importance

Tail (80%):
- Low frequency, low impact
- Distributed value
- Individually small but total volume significant
Why the Law Works
Cause 1: Power Law
Many phenomena follow power law rather than normal distribution:
Normal Distribution (Bell Curve):
- Concentrated around mean
- Extreme values rare
- Example: Human height

Power Law Distribution:
- Extreme inequality
- Few gigantic elements
- Examples: City populations, company sizes, wealth distribution
Cause 2: Cumulative Advantage
Success breeds success mechanism:
Initial small advantage
→ Attention and resources concentrate
→ Further advantage expansion
→ Exponential divergence

"The rich get richer"
Matthew Effect
Cause 3: Emergent Properties of Complex Systems
Born from interactions among numerous elements:
Individual elements = Equal capability
Interactions = Non-linear results
Emergence = Unexpected inequality

Examples: Network effects, word-of-mouth, brand value
Evidence Analysis: The universality of the Pareto Principle emerges from the inherent non-linearity and complexity of nature, society, and economics. Equal distribution is a theoretical ideal; reality is always unequal.
Implementation Procedure of the Pareto Principle - Investigation Methods
Investigation Finding 1: Microsoft's Bug-Fixing Strategy
Case Evidence (Windows Development Team Discovery):
Phase 1: Data Collection (Early 2000s)
Situation: - Massive bug reports for Windows OS - Limited development resources - Release deadline pressure
Analysis begins:
Question: Which bugs should we prioritize?

Traditional approach:
- Fix in order reported
- Allocate resources equally
- Comprehensive coverage of all bugs

Problems:
- Critical bugs postponed
- Time wasted on trivial fixes
- Release delays
Phase 2: Implementing Pareto Analysis
Facts discovered:
Bug frequency analysis:
Total bugs: 10,000
Total crashes: 100,000

Shocking results:
Top 20% of bugs (2,000)
→ Caused 80% of crashes (80,000)

Meaning:
Remaining 80% of bugs (8,000)
→ Only 20% of crashes (20,000)
Detailed breakdown:
Top 1% of bugs (100)
→ 50% of all crashes

Top 5% of bugs (500)
→ 70% of all crashes

Top 20% of bugs (2,000)
→ 80% of all crashes
Phase 3: Strategic Transformation
New policy implementation:
Old strategy:
Treat all bugs equally
→ 10,000 bugs × 1 day average = 27 months

New strategy (Pareto Principle):
1. Prioritize top 20% bugs
2. Sort by crash frequency
3. Concentrate resources

Results:
2,000 bugs × 2 days (higher difficulty) = 11 months
→ 80% improvement in user experience
→ 60% reduction in release time
Implementation details:
Weekly bug triage meetings:
1. Aggregate crash reports
2. Conduct Pareto analysis
3. Identify top 20%
4. Priority directives to dev teams

Dashboard:
- Real-time crash frequency
- Cumulative contribution graph
- Predicted improvement from fixes
Phase 4: Continuous Improvement
Additional discoveries:
Pareto at module level too:
Total modules: 500
Problem modules: ~100 (20%)
→ Contain 80% of all bugs

Pareto at feature level too:
Total features: 5,000
Frequently used: ~1,000 (20%)
→ 80% of all usage time
Strategic implications:
Optimizing investment allocation:
- Concentrate QA on critical 20% modules
- Strategic deployment of testing resources
- Prioritized code reviews
Outcomes: - Improved stability from Windows Vista onward - Shortened development cycles - Enhanced user satisfaction
Investigation Finding 2: Amazon's Inventory Management Revolution
Case Evidence (20% of products generate 80% of sales):
Phase 1: Problem Discovery
Initial challenges (Late 1990s):
When book sales started:
Product catalog: 1+ million items
Warehouse space: At capacity
Inventory costs: Enormous

Jeff Bezos's question:
"Do we need to treat all products the same?"
Phase 2: Data Analysis
Sales data shock:
Analysis results (1999):
Top 20% of products (200,000)
→ 80% of revenue

Top 1% of products (10,000)
→ 50% of revenue

Long tail (80% of products)
→ 20% of revenue
→ Yet inventory costs equal
Phase 3: Introducing ABC Analysis
Practical deployment of Pareto Principle:
A-Class products (20%):
- High turnover rate
- Constant inventory
- Placed in Prime warehouses
- Fast shipping response

B-Class products (30%):
- Medium turnover
- Demand-forecasted inventory
- Distributed across regional warehouses

C-Class products (50%):
- Low turnover
- Minimal inventory or order-based
- Supplier drop-shipping
Phase 4: Systematization
Automated prioritization:
Real-time Pareto analysis:
- Daily sales data analysis
- Dynamic ABC classification
- Automatic seasonal adjustments

Inventory placement algorithm:
IF (product in top 20%)
  THEN place in Prime warehouse
ELSE IF (in top 50%)
  THEN place in regional warehouse
ELSE
  order-based model
Outcomes: - 3x improvement in inventory turnover - 40% reduction in warehouse costs - Improved delivery speed
Investigation Finding 3: Application to Personal Time Management
Case Evidence (ROI Detective Agency Practice):
Phase 1: Time Usage Visualization
One-week log:
Total work hours: 50 hours

Activity breakdown:
1. Article writing: 15 hours (30%)
2. Research: 8 hours (16%)
3. Email responses: 7 hours (14%)
4. Meetings: 6 hours (12%)
5. Social media posts: 4 hours (8%)
6. System adjustments: 3 hours (6%)
7. Other miscellaneous: 7 hours (14%)
Phase 2: Linking to Outcomes
Measuring value creation:
Outcome metrics:
- Articles published
- Traffic increase
- Revenue
- Reader feedback

Analysis results:
Article writing 15 hours (30%)
→ Generated 70% of outcomes

Research 8 hours (16%)
→ Generated 20% of outcomes

Total 23 hours (46% of time)
→ 90% of outcomes

Remaining 27 hours (54% of time)
→ 10% of outcomes
Phase 3: Redesigning Time Allocation
Strategic transformation:
Old allocation:
High-value activities: 46%
Low-value activities: 54%

New allocation target:
High-value activities: 70%
Low-value activities: 30%

Specific measures:
1. Email response efficiency
   - Create templates
   - Fixed response times
   7 hours → 3 hours

2. Meeting reduction
   - Decline unnecessary meetings
   - 30-minute principle
   6 hours → 3 hours

3. Miscellaneous task reduction
   - Outsource/automate
   - Decision to stop
   7 hours → 3 hours

Reallocate saved time (11 hours) to
article writing and research
Phase 4: Continuous Monitoring
Weekly review:
Every Friday:
1. Reflect on time usage
2. Update Pareto analysis
3. Decide next week's priorities

Utilizing [Baseline of Measurement (BOM)](/behind_case_files/articles/X041_BOM):
- Rate each activity's value on 10-point scale
- Calculate value per hour
- Decision-making for low-value activity reduction
Outcomes: - 1.5x increase in article writing time - 2x increase in articles published - Stress reduction (fewer low-value activities)
The Power of the Pareto Principle - Criminal Effects
Power 1: Strategic Resource Allocation
Exponential efficiency improvement:
Equal allocation:
100% resources → 100% outcomes

Pareto allocation:
20% resources → 80% outcomes
4x efficiency (80/20 = 4)

Extreme cases:
10% resources → 50% outcomes
5x efficiency (50/10 = 5)
Power 2: Clear Prioritization
Simplification of decision-making:
Question: 100 tasks, which to choose?

Pareto analysis:
1. Evaluate all tasks by impact
2. Identify top 20
3. Concentrate on these 20

Results:
- 80% reduction in decision time
- 80% outcomes maintained
- Clear focus
Power 3: Liberation from Perfectionism
Integration with Realization First Principle:
Perfectionist:
"Must be 100% perfect"
→ Never finishes

Pareto practitioner:
"Realize 80% value in 20% time"
→ Quick release
→ Improve remaining 20% as needed
Power 4: Scientific Basis for MVP
Minimal feature selection:
All feature candidates: 100

Pareto analysis:
Top 20% features (20)
→ 80% of user value

MVP decision:
Implement these 20 features
→ 1/5 development time
→ 80% value retained
Limitations and Cautions of the Pareto Principle - Investigation Warnings
Warning 1: Absolutizing the Ratio
Misconception:
❌ Always exactly 80:20
❌ Applicable to all domains
❌ Mathematical law

Reality:
✅ Approximate tendency
✅ Suggests existence of inequality
✅ Empirical rule / heuristic
Warning 2: Ignoring the Long Tail
Important caution:
Focus on 20% ≠ Ignore 80%

Reasons:
- Long tail contains niche value
- Still contributes 20% in aggregate
- Contains future 20% candidates

Amazon's strategy:
Head (20%): High turnover, high profit
Tail (80%): Rich assortment, differentiation
Warning 3: Dynamic Change
Pareto distribution is not static:
Today's top 20%
≠ Tomorrow's top 20%

Factors:
- Market changes
- Competitive dynamics
- Trends
- Technological innovation

Response:
Continuous monitoring and re-analysis
Warning 4: Confusing Correlation with Causation
Correlation ≠ Causation:
"Top 20% is important, so concentrate"
→ Correct

"Only do the top 20%"
→ Dangerous

Reason:
- Foundational 80% may support the 20%
- Overall ecosystem health
Related Case Files - Additional Investigation Materials
Related Frameworks:
Realization First Principle → Pareto analysis for bottleneck identification
MVP → Selection criteria for minimal features
Agile Development → Product backlog prioritization
Baseline of Measurement (BOM) → Value quantification and top 20% identification
Industry-Specific Pareto Cases - Field Evidence
B2B Sales:
20% of customers → 80% of revenue
20% of sales reps → 80% of deals closed

Strategy:
- Key account management
- Share top performer know-how
Software Development:
20% of features → 80% of usage time
20% of code → 80% of bugs

Strategy:
- Quality concentration on primary features
- Focused testing on high-risk modules
Content Business:
20% of articles → 80% of traffic
20% of videos → 80% of viewing time

Strategy:
- Analyze and replicate hit articles
- Concentrate investment in popular content
Investigation Conclusion - Detective's Conclusion
The Pareto Principle shatters the beautiful illusions of perfectionism and egalitarianism. The world is not equal, influence is unevenly distributed, and success depends on the ability to identify "the vital few."
The 80:20 ratio is not a magic number but a symbol of inequality. What Microsoft, Amazon, and countless successful entities have proven is the inefficiency of the "treat everything equally" strategy and the power of choosing "concentration on the vital few."
But the true insight isn't knowing the Pareto Principle—it's having the analytical capability to identify "what that 20% is" in your domain. Measure data, visualize it, identify the top performers, concentrate—this scientific process transforms the law from knowledge into a weapon.
Don't ignore the long tail, respond to dynamic changes, and continuously re-analyze. The Pareto Principle is an invitation to the endless journey of optimization.
ROI Detective Agency's Conclusion: Those who pursue everything achieve nothing. Those who identify the vital few and pour all their energy there capture the greatest outcomes. Inequality is reality, and only those who accept this reality gain strategic advantage.
Case Status: SOLVED ✓ Classification: Science of Prioritization | Resource Allocation Optimization
🎖️ Top 3 Weekly Ranking of Case Files

'PharmaLogistics' Invisible Customer'

'Bravura Retail's Paper Culture: A 2025 Relic'

'UrbanDesign's Blueprint Labyrinth'
Solve Your Business Challenges with Kindle Unlimited!
Access millions of books with unlimited reading.
Read the latest from ROI Detective Agency now!
*Free trial available for eligible customers only