ROI Case File No.243 | 'North American EV Startup's Fundraising'
📅 2025-10-08 23:00
🕒 Reading time: 16 min
🏷️ AARRR

- Chapter 1: Future Visible at the Bottom of Funds — The Last Opportunity
- Chapter 2: The Invisible Growth Trajectory — Drifting Without Metrics
- Chapter 3: AARRR Depicts the Growth Curve — The Power of Pirate Metrics
- Chapter 4: Monetization and Investor Trust — Numbers Tell the Future
- Chapter 5: Detective's AARRR Diagnosis — The Blueprint of Growth
- Chapter 6: Proof of Growth Engine — The Future Investors Saw
- Detective's Perspective — The Weapon Called Growth Visualization
- Related files
Chapter 1: Future Visible at the Bottom of Funds — The Last Opportunity
The week following the resolution of Desert Crown's MECE structuring case, an urgent consultation regarding fundraising arrived from North America. The third case in Volume 19 "New Frontiers of Analysis" concerned problems where ambiguous growth indicators caused loss of investor trust.
"Detective, we are a North American startup operating in the EV (electric vehicle) sector, but our next fundraising round may be our last chance. Investors question our growth potential and demand clear evidence of growth. However, we don't know which indicators to present."
Jason Chen, co-founder and CEO of Velocity Motors Inc., visited 221B Baker Street with a serious expression. In his hands, he held technically excellent product materials and, in stark contrast, financial documents showing fundraising difficulties.
"We are a startup developing next-generation EV solutions for the North American market. We have absolute confidence in our technical capabilities, but business growth isn't being properly communicated to investors."
Velocity Motors' Technical Superiority: - Founded: 2021 (EV technology-focused startup) - Technology Development: 15 patents in next-generation battery technology - Product Performance: 1.4 times industry average range, half the charging time - Expert Personnel: 25 former Tesla and GM engineers - Initial Investment: 3.5 billion yen raised in seed round
The numbers certainly indicated high technical capabilities. However, Jason's expression bore deep anxiety.
"The problem is that while we have 'excellent technology,' we can't prove to investors that we're a 'sustainable growth business.' If we fail at the next Series A fundraising, the company will run out of funds within 6 months."
Serious Gap Between Technical Capabilities and Business Growth: - Fundraising Status: Only 2 billion yen expressions of interest against Series A target of 15 billion yen - Fund Balance: Currently 1.5 billion yen (monthly burn 500 million yen, 3 months remaining) - Customer Acquisition: Prototype evaluations are positive but don't lead to contracts - Monetization: Only technology licensing revenue, no product sales - Investor Evaluation: "Technology is excellent but business model is unclear"
"We're completely at a loss regarding 'what constitutes growth and what doesn't' and 'which indicators to track.' We're running out of time."
Chapter 2: The Invisible Growth Trajectory — Drifting Without Metrics
"Mr. Jason, what indicators and growth stories are you presenting to investors?"
Holmes quietly inquired.
Jason began explaining the current situation with a confused expression.
"We've been focusing on technical superiority and market potential, but investors point out that we lack visibility into 'actual customer behavior,' 'growth trajectory,' and 'path to monetization.'"
Velocity Motors' Current Investor Presentation Content:
Technology-Centered Appeal (Insufficient for Investors): - Battery Technology Superiority: Numerical comparison of range and charging time - Patent Portfolio: Entry barriers through 15 technical patents - Engineering Capabilities: Development team with extensive industry experience - Product Roadmap: 3-year technical development plan
Abstract Market Opportunity Explanation: - EV Market Size: North American EV market growth projections (+25% annually) - Competitive Comparison: Performance superiority over existing EVs - Future Projections: 2030 EV adoption rate forecasts - Market Entry Strategy: Plans for both B2B and B2C markets
I focused on the absence of customer behavior and growth indicators.
"Technical capabilities are clear, but the process of how actual customers discover, try, purchase, and continue using the product is invisible."
Jason answered with a serious expression.
"That's exactly the problem. We've been focused on 'building the product,' but haven't systematically considered 'acquiring, retaining, and monetizing customers.'"
Current State of Customer Acquisition and Retention (Unstructured):
Fragmented Customer Contact Situation: - Website Visits: 12,000 monthly visits (visitor details unknown) - Trade Show Participation: 4 times annually (limited follow-up contact with visitors) - Media Coverage: 15 tech media mentions (no effect measurement) - Social Media: 8,500 followers (low engagement)
Ambiguous Trial and Evaluation Situation: - Prototype Experience: Cumulative 500 people (post-experience behavior unknown) - Technical Evaluation: 15 companies (evaluations positive but no contract progress) - Pilot Programs: 3 companies currently implementing (no success measurement criteria) - Feedback: Many positive reviews (not quantified or systematized)
Opaque Monetization Situation: - Technology Licensing: Contracts with 2 companies (800 million yen annually) - Product Reservations: 200 units for B2C (actual purchase intent unknown) - Corporate Contracts: 10 companies in negotiations (probability and timing unclear) - Revenue Projections: Only optimistic scenarios (no risk assessment)
Specific Harsh Criticisms from Investors:
Major VC Partner A: "The technology is excellent, but we can't see whether customers will actually pay to keep using it. Please demonstrate customer acquisition costs, retention rates, and monetization processes with numbers."
Government Fund B: "We understand the market potential, but the specific roadmap for how your company will grow in that market is unclear. Please show staged growth indicators."
Angel Investor C: "The product is excellent, but the business model is invisible. Which customers will use it, why, how much, and for how long is unclear."
"We intended to 'compete with technology,' but investors are seeking 'business growth.' But we don't know what or how to measure."
Chapter 3: AARRR Depicts the Growth Curve — The Power of Pirate Metrics
⬜️ ChatGPT | Catalyst of Conception
"Acquisition, Activation, Retention, Referral, Revenue. Five metrics depict the complete picture of growth."
🟧 Claude | Alchemist of Narrative
"Narrating the customer journey with numbers. That's the story that moves investors' hearts."
🟦 Gemini | Compass of Reason
"AARRR is the anatomy of growth. Optimizing each stage accelerates the whole."
The three members began their analysis. Gemini displayed an "EV Industry-Specific AARRR Analysis" framework on the whiteboard.
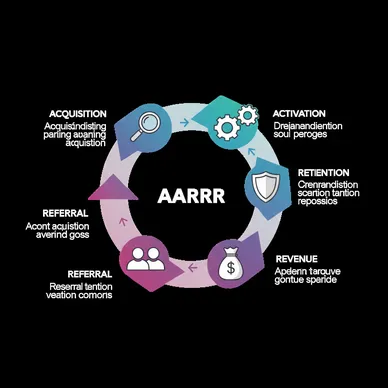
AARRR (Pirate Metrics) Five Stages: - A (Acquisition): Acquiring new customers - A (Activation): Achieving first value experience - R (Retention): Continued use and engagement - R (Referral): Expansion through word-of-mouth and referrals - R (Revenue): Monetization
"Mr. Jason, let's systematically analyze and design Velocity Motors' customer behavior using the AARRR model."
Velocity Motors' AARRR Current Analysis and Redesign:
A1 (Acquisition) Current State and Improvement
Current Acquisition Status: - Website Visits: 12,000 monthly (traffic sources unknown, no quality assessment) - Trade Shows: 4 annual participations (high cost, no effect measurement) - Media: Tech-focused only (business media unexplored) - Social Media: 8,500 followers (no target audience analysis)
AARRR-Improved Acquisition Strategy: - Target Clarification: Corporate (fleet management), Individual (early adopters) - Channel Optimization: LinkedIn (B2B), YouTube (product demos), industry events - Content Strategy: Shift from technical explanations to "EV adoption ROI" and "operational cost reduction" - Effect Measurement: CAC (customer acquisition cost), channel-specific conversion rates
A2 (Activation) Current State and Improvement
Current Activation Status: - Prototype Experience: 500 people (no post-experience action tracking) - Technical Evaluation: 15 companies (evaluation criteria and timeline ambiguous) - Initial Contact: Trade show business card exchange (insufficient follow-up) - Value Understanding: Technology-focused explanation (insufficient business value explanation)
AARRR-Improved Activation Strategy: - "Aha! Moment" Design: Clear value realization in first experience - Onboarding: Staged product understanding program - Value Demonstration: 30-day pilot program (with ROI measurement) - Activation Indicators: Technical evaluation completion rate, pilot participation rate, value perception
R1 (Retention) Current State and Improvement
Current Retention Status: - Pilot Continuation: 3 companies implementing (continuation criteria unclear) - Long-term Use: No data (no tracking system) - Satisfaction: Only subjective feedback (no quantitative evaluation) - Problem Resolution: Technical support only (insufficient business value follow-up)
AARRR-Improved Retention Strategy: - Continuous Value Provision: Technical support + operational cost optimization consulting - Engagement Strengthening: Monthly reports, improvement proposals, benchmark provision - Problem Prevention: Preventive maintenance, updates, training - Retention Indicators: Monthly usage rate, satisfaction scores, contract renewal rate
R2 (Referral) Current State and Improvement
Current Referral Status: - Word-of-mouth: Only organic (no promotion mechanisms) - Referral Program: No program - Case Sharing: Underutilized customer success stories - Industry Influence: Tech media only (insufficient business influence)
AARRR-Improved Referral Strategy: - Referral Incentives: Discounts and benefits for successful referrals - Success Case Sharing: Customer ROI improvement stories as case studies - Community Formation: User conferences and technical exchange meetings - Referral Indicators: NPS (Net Promoter Score), referral conversion rate, viral coefficient
R3 (Revenue) Current State and Improvement
Current Revenue Status: - Technology Licensing: 800 million yen annually (only 2 companies) - Product Sales: None (reservations only) - Revenue Model: One-time sales focus (insufficient recurring revenue) - Pricing: Cost-based (no value-based pricing)
AARRR-Improved Revenue Strategy: - Multi-tier Revenue Model: Product sales, subscriptions, services, licensing - Value-Based Pricing: Pricing based on customer ROI - Upsell and Cross-sell: Maintenance, upgrades, additional features - Revenue Indicators: LTV (customer lifetime value), ARPU, churn rate, MRR
Claude reported an important discovery.
"This is clear. Velocity Motors is technically excellent but lacks a systematized funnel from customer acquisition to monetization, preventing optimization at each stage. AARRR visualization clarifies the complete growth picture and improvement points."
Most Important Discovery: "Growth Engine Design"
AARRR enables specific process design to convert technical capabilities into sustainable business growth. Numerical targets and improvement measures at each stage realize the "predictable growth" investors seek.
Chapter 4: Monetization and Investor Trust — Numbers Tell the Future
Following detailed AARRR analysis and growth strategy design, Velocity Motors' investment value improvement potential became clear.
Transition from "Technology-Centered Presentation" to "Growth Engine Demonstration":
Core Problem: Lack of Growth Process Visualization
Velocity Motors possessed excellent technology but lacked clarity in the process of converting that technology into sustainable business growth.
Detailed AARRR Growth Engine Design:
Phase 1: Growth Funnel Optimization (6 months)
Acquisition Optimization: - B2B Channels: LinkedIn, industry events, partner referrals - B2C Channels: YouTube, influencers, test drive events - Target: 500 monthly lead acquisitions (5x current 100) - KPI: CAC below 500,000 yen, conversion rate above 5%
Activation Optimization: - B2B Activation: 30-day pilot program (with ROI measurement) - B2C Activation: Test drive experience (performance realization), customization experience - Target: 30% activation rate (3x current 10%) - KPI: 80% pilot completion rate, 4.5/5 value perception
Retention Optimization: - Value Provision: Operational cost reduction reports, performance optimization services - Engagement: Monthly reviews, user community - Target: 70% 12-month retention rate (exceeding 50% industry average) - KPI: 90% monthly usage rate, satisfaction above 4.0/5
Phase 2: Revenue Engine Construction (12 months)
Multi-tier Revenue Model Implementation:
Product Sales (Primary Revenue): - B2B: 1,000 fleet EVs annually (average unit price 8 million yen) - B2C: 500 individual EVs annually (average unit price 6 million yen) - Sales Target: 11 billion yen annually
Subscriptions (Recurring Revenue): - Maintenance Plan: 80,000 yen/month (B2B), 30,000 yen/month (B2C) - Software Updates: 20,000 yen/month - Annual Recurring Revenue: 2.5 billion yen
Services and Licensing (Additional Revenue): - Technology Licensing: 1.5 billion yen annually (expansion from current 800 million yen) - Consulting: EV adoption support 800 million yen annually - Additional Revenue: 2.3 billion yen
Total Revenue Target: 15.8 billion yen annually (20x current 800 million yen)
Innovation in Investor Presentation Materials:
Before AARRR (Technology-Centered): - Technical superiority explanation (30 minutes) - Market potential explanation (15 minutes) - Future plan explanation (15 minutes) - Q&A (30 minutes)
After AARRR (Growth Engine-Centered): - Growth funnel performance and plans (20 minutes) - KPIs and improvement measures for each stage (25 minutes) - Revenue model and financial projections (25 minutes) - Risks, countermeasures, execution plan (10 minutes)
Specific Indicators Investors Can Confirm: - Monthly-based growth tracking - Conversion rate improvements at each stage - Predictable revenue growth curve - Risk factors and countermeasures
Comparison with Success Cases:
AARRR-Utilizing Successful Startup (US Company A): - Tech startup, same scale and founding period - Before AARRR: Fundraising difficulties, sluggish growth - After AARRR: Successful fundraising through growth visualization, business expansion - Success Factors: Clear growth story presentation to investors
Velocity Motors' Potential: Similar approach expected to gain investor trust and successful fundraising
Chapter 5: Detective's AARRR Diagnosis — The Blueprint of Growth
Holmes summarized the comprehensive analysis.
"Mr. Jason, the essence of the AARRR model is 'the anatomy of growth.' By converting technical capabilities as raw materials into staged customer experiences and monetization processes, you can realize the predictable and sustainable growth investors seek. AARRR is not just metrics but a blueprint for growth engines."
AARRR Growth Strategy: Transition from "Technology Appeal" to "Growth Demonstration"
Basic Strategic Policy: Growth Engine Validation
Phase 1: AARRR Foundation Construction (3 months)
Growth Measurement System Construction: - Data Infrastructure: Behavioral data acquisition and analysis system for each stage - Dashboard: Real-time AARRR indicator monitoring - Experimentation System: A/B testing and improvement measure effectiveness measurement - Reporting: Monthly growth reports for investors
Funnel Optimization Foundation: - Customer Segments: Detailed persona design for B2B and B2C - Channel Strategy: Optimal acquisition channels for each segment - Content Strategy: Value proposition content for each stage - Operations: Organizational structure for funnel management and improvement
Phase 2: Growth Engine Implementation (9 months)
Execution of Each AARRR Stage: - A1 Optimization: Monthly lead acquisition system of 500 - A2 Optimization: Program achieving 30% activation rate - R1 Optimization: Service maintaining 70% retention rate - R2 Optimization: Referral and word-of-mouth promotion system - R3 Optimization: Multi-tier revenue model implementation
Investor Communication: - Monthly Reports: Regular AARRR indicator reporting - Growth Demonstration: Presenting growth trends with numbers - Forecast Accuracy: Improving growth prediction accuracy - Risk Management: Clear indication of risk factors and countermeasures at each stage
Phase 3: Scale Preparation (Ongoing)
Growth Acceleration System: - Product Enhancement: Product improvement based on user feedback - Operations Efficiency: Business process optimization for growth - Organizational Scale: Personnel and organizational expansion according to growth stage - Funding Plan: Growth investment and next round fundraising strategy
Expected Effects: - Sales Growth: 800 million yen → 15.8 billion yen (20x in 3 years) - Customer Acquisition: Monthly 100 → 500 (5x) - Retention Rate: Currently unknown → 70% (industry top level) - Investor Trust: Significant improvement
Investment Plan: - AARRR Implementation: 2 billion yen annually - Expected Benefits: 15 billion yen annually (growth realization) - Fundraising: 15 billion yen successful fundraising (target achievement) - Corporate Value: 10x improvement
"What's important is converting technical capabilities into growth engines. AARRR is the blueprint that depicts the story of growth that moves investors' hearts."
Chapter 6: Proof of Growth Engine — The Future Investors Saw
12 months later, a report arrived from Velocity Motors Inc.
Business Transformation Results through AARRR Growth Engine:
Dramatic Fundraising Success: - Series A Fundraising: Target 15 billion yen → Actual 18 billion yen (120% achievement) - Investor Evaluation: Perception shift from "technology company" to "growth company" - Fundraising Period: 18 months of struggle → Completed in 6 months - Number of Investors: 3 expressions of interest → 12 final participants
Success at Each AARRR Stage:
Acquisition Success: - Monthly Leads: 100 → 520 (5.2x growth) - CAC: Estimated 2 million yen → Actual 450,000 yen (successful efficiency) - Channel Diversification: Trade shows only → LinkedIn, YouTube, partners - Quality Improvement: Shift from tech enthusiasts to purchase consideration focus
Activation Success: - Activation Rate: 10% → 32% (3.2x improvement) - Pilot Completion Rate: 50% → 85% (significant improvement) - Value Perception: Technical evaluation → Business ROI realization - B2B Success: Average 30% cost reduction demonstrated
Retention Success: - 12-month Retention Rate: Unknown → 75% (industry top level) - Customer Satisfaction: Subjective → 4.3/5 (quantitative evaluation) - Engagement: Technical support only → Comprehensive value provision - Upsell Success: 60% of continuing customers using additional services
Referral Success: - NPS: Not measured → 65 (significantly exceeding industry average of 40) - Referral Acquisition: 0% → 25% (1/4 of new acquisitions from referrals) - Word-of-mouth: Organic → Systematic referral program - Industry Influence: Tech media → Attention from business media too
Revenue Success: - Annual Sales: 800 million yen → 8.5 billion yen (10x growth) - Revenue Structure: Licensing only → 4 revenue sources - LTV: Unknown → Average 24 million yen (B2B), 8 million yen (B2C) - Profit Margin: Loss → 18% (healthy profitability)
Investor Evaluation Changes:
Investor A (Major VC): "We've always valued the technology, but AARRR implementation clarified the growth roadmap. The KPIs at each stage and their improvement trends gave us confidence in our investment decision."
Investor B (Government Fund): "Monthly AARRR reports allow us to continuously confirm business health and growth potential. Such a transparent startup is rare, and we're considering additional investment."
Investor C (Strategic Investor): "We evaluate it as a business company with growth engines, not just a technology company. The high retention rate especially indicates long-term business value."
Qualitative Changes in Business Results:
Organizational Growth: - Employee Count: 25 → 85 (3.4x expansion) - Specialization Expansion: Engineers only → Marketing, sales, customer success - Data-Driven Culture: Intuitive judgment → Number-based decision-making - Growth Orientation: Technical perfectionism → Customer value maximization
Market Position Improvement: - Industry Evaluation: "Tech startup" → "Growth company benchmark" - Customer Evaluation: "Trial adoption" → "Strategic partner" - Competitor Evaluation: "Technical threat" → "Business model threat" - Media Evaluation: "Technical news" → "Business success story"
Employee Changes:
Engineer (3 years with company): "Previously, I pursued technical perfection, but after AARRR implementation, I constantly think about how customers actually use things. Being able to confirm technical value with numbers is enjoyable."
New Marketing Director (1 year with company): "Being able to implement improvement measures while watching conversion rates at each stage makes marketing effects clear. Investors also evaluate us as a 'company that speaks with numbers.'"
Sales Director (6 months with company): "AARRR indicators allow analysis of which customers are likely to continue and when to approach. Closing rates have improved dramatically."
Next Growth Stage: - Series B Preparation: Target 30 billion yen fundraising within the year - International Expansion: Expansion plans for European and Asian markets - Product Expansion: New product development based on AARRR analysis - IPO Preparation: View toward stock listing in 3 years
Jason's letter contained deep gratitude and new confidence:
"Through AARRR implementation, we transformed from 'a company selling technology' to 'a company demonstrating growth.' Most importantly, having excellent technology alone was insufficient; we needed to visualize the process of converting that technology into customer value and revenue. Investors evaluate not technological capabilities themselves but the ability to convert technology into growth. By proving that ability with numbers through AARRR, we gained investor trust and pushed the business to the next level. Now watching monthly growth indicators is enjoyable, and the entire team functions as part of the growth engine. AARRR is not just indicators but a blueprint for converting technology into business success."
Detective's Perspective — The Weapon Called Growth Visualization
That night, I pondered deeply about the importance of growth indicators.
Velocity Motors' case vividly demonstrated the typical challenge tech startups face—the gap between technical capabilities and business growth. No matter how excellent the technology, without visualizing the process of converting it into sustainable business growth, gaining investor trust is impossible.
The true value of the AARRR model lies in decomposing customer behavior into five stages and building an overall growth engine through optimization at each stage. Particularly for startups, this growth process visualization becomes key to building trust relationships with investors and continuous fundraising.
In Volume 19 "New Frontiers of Analysis," while Case 241's SWOT analysis showed the importance of reality recognition and Case 242's MECE analysis demonstrated the power of information structuring, Case 243's AARRR analysis proved value creation through growth process visualization.
"Technology is a means. True value lies in converting that technology into customer success and corporate growth."
The next case will surely depict another moment when analytical methods dramatically expand corporate possibilities to new dimensions.
"Growth is not coincidence. It is designed, measured, and optimized. AARRR is the navigation chart for reliably realizing that growth." — From the Detective's Notes
Related files
🎖️ Top 3 Weekly Ranking of Case Files

'PharmaLogistics' Invisible Customer'

'PrintMaster's Visual Inspection Mental Hell'

'Global Solutions Inc.'s Triple-Entry Infinite Hell'