ROI Case File No.253 | 'North American Retailer's Customer Understanding'
📅 2025-10-13 23:00
🕒 Reading time: 7 min
🏷️ RFM

- Chapter One: The Truth Hidden Behind Sales—Not All Customers Are Equal
- Chapter Two: Sorting Customers with RFM—Three Metrics Reveal Truth
- Chapter Three: The Effect of Concentration Strategy—Identifying Premium Customers
- Chapter Four: Optimizing Profit Structure—Dramatic Improvement in Investment Effectiveness
- Chapter Five: The Detective's RFM Diagnosis—Customers Are Not Equal
- The Detective's Perspective—The Eye That Discerns Value
- Related files
Chapter One: The Truth Hidden Behind Sales—Not All Customers Are Equal
The week following the resolution of NordWind Energy's PEST analysis case, a consultation arrived from North America regarding retail business revenue structure. This case, the 253rd episode of the twentieth volume "Integration of Practice," concerned the challenge of discovering truth buried in customer data and implementing strategic customer management.
"Detective, we operate a 200-store retail chain across North America, but despite increasing customer numbers, our profit margin is declining. We've been treating all customers equally, but perhaps that's been a mistake."
Sarah Johnson, customer strategy director at RetailMax USA from Chicago, visited 221B Baker Street unable to hide her confusion. In her hands, she held a massive customer database alongside starkly simple customer classification documents.
"We're a retail chain selling home electronics and furniture across North America. We've accumulated customer data but can't leverage it strategically. We invest equally in marketing to all customers, but effectiveness is diminishing."
RetailMax USA's Business Scale and Challenges: - Founded: 2010 (rapidly growing retail chain) - Store Count: 200 stores (USA and Canada) - Annual Revenue: ¥120 billion - Members: 2.5 million - Product Categories: Electronics, furniture, household goods
The numbers showed steady growth. However, deep concern was etched on Sarah's face.
"The problem is that as customer numbers increase, profit margins decrease. We're investing heavily in new customer acquisition, but many customers purchase only once and never return, preventing investment recovery."
Distorted Customer Structure: - New customer acquisition cost: Average ¥8,000 per person - One-time purchase customers: 65% of total - Repeat customers: 35% but account for 80% of sales - Marketing investment: Distributed equally across all customers - Profit margin: Declining annually (15% → 8%)
"We believed 'more customers equals more sales,' but in reality, we may have just been increasing unprofitable customers."
Chapter Two: Sorting Customers with RFM—Three Metrics Reveal Truth
"Ms. Johnson, what criteria are currently used for customer management and marketing strategy?"
Holmes inquired quietly.
Sarah began explaining the current situation with a perplexed expression.
"Basically, we treat all customers the same. We have member ranks based solely on cumulative purchase amount, without considering recent purchasing behavior. As a result, we continue sending direct mail to customers who no longer visit."
Current Customer Management Reality (Simple, Non-Strategic):
Customer Classification: - Gold Members: Cumulative purchases over ¥500,000 - Silver Members: Cumulative purchases over ¥200,000 - Regular Members: Everyone else
Problems: - Purchased ¥500,000 five years ago but no visits since → Treated as Gold - Purchasing ¥50,000 monthly → Treated as Regular - Purchase frequency and latest purchase date not considered
Marketing Initiatives: - Direct mail: Sent monthly to all members with identical content - Coupons: Discount rates vary by member rank - Event invitations: Special events for Gold members only
Results: - Direct mail open rate: 8% (stagnant) - Coupon usage rate: 3% (inefficient) - Marketing ROI: 60% of investment wasted
I noted the uniform approach ignoring customer diversity.
"Not all customers have equal value. You need to properly understand customer status."
Sarah responded with a serious expression.
"Indeed, treating 2.5 million customers uniformly feels impossible."
⬜️ ChatGPT | Catalyst of Conception
"Recency, Frequency, Monetary. Three axes reveal customers' true value."
🟧 Claude | Alchemist of Narrative
"Identify and nurture premium customers. That's the key to sustainable growth."
🟦 Gemini | Compass of Reason
"RFM analysis is a mirror reflecting customers' present. Measuring current value, not past."
The three members began their analysis. Gemini deployed a "Retail Industry-Specific RFM Analysis" framework on the whiteboard.
Basic Structure of RFM Analysis: - R (Recency): Latest Purchase Date - Days elapsed since last purchase - F (Frequency): Purchase Frequency - Number of purchases within set period - M (Monetary): Purchase Amount - Total purchase amount within set period
"Ms. Johnson, let's segment RetailMax's 2.5 million customers by true value using RFM."
Chapter Three: The Effect of Concentration Strategy—Identifying Premium Customers
RetailMax USA's RFM Analysis Implementation:
Phase 1: RFM Scoring (1 month)
Rating each customer on 3 metrics using 5-point scale:
Recency (Latest Purchase Date): - 5 points: Within 30 days - 4 points: Within 31-60 days - 3 points: Within 61-90 days - 2 points: Within 91-180 days - 1 point: 181 days or more
Frequency (Purchase Frequency - Past 12 months): - 5 points: 10+ times - 4 points: 7-9 times - 3 points: 4-6 times - 2 points: 2-3 times - 1 point: 1 time
Monetary (Purchase Amount - Past 12 months): - 5 points: ¥500,000+ - 4 points: ¥300,000-490,000 - 3 points: ¥150,000-290,000 - 2 points: ¥50,000-140,000 - 1 point: Under ¥50,000
Phase 2: Customer Segment Discovery
Shocking Discovery:
True Premium Customers "Champions" (RFM: 5-5-5): - Number: 25,000 (1% of total) - Sales contribution: ¥24 billion (20% of total) - Average purchase: ¥960,000 annually - Characteristics: Recent, frequent, high-value purchases
Loyal Customers (RFM: 4-5-4, etc.): - Number: 125,000 (5% of total) - Sales contribution: ¥48 billion (40% of total) - Average purchase: ¥380,000 annually - Characteristics: Regular purchases, stable amounts
At Risk Customers (RFM: 3-5-5, etc.): - Number: 50,000 (2% of total) - Characteristics: Past premium customers but no recent visits - Risk: High possibility of permanent churn
Hibernating Customers (RFM: 1-1-2, etc.): - Number: 1,625,000 (65% of total) - Sales contribution: ¥12 billion (10% of total) - Characteristics: One purchase, no visits for extended period
Strategic Shift Decision:
Shift from uniform investment to RFM segment-specific strategic investment.
Champions & Loyal Customers (75,000 people, 60% of sales): - Marketing investment: Concentrate 60% of total - Initiatives: VIP program, dedicated concierge, exclusive products - Goal: Maintain continued purchases, further increase purchase value
At Risk (50,000 people): - Investment: 20% allocation - Initiatives: Special offers, personalized proposals, phone follow-ups - Goal: Promote return visits, prevent churn
Hibernating Customers (1,625,000 people): - Investment: Only 10% - Initiatives: Low-cost digital initiatives only - Goal: Target only partial reactivation
Chapter Four: Optimizing Profit Structure—Dramatic Improvement in Investment Effectiveness
Results After 12 Months:
Revenue Structure Transformation: - Annual revenue: ¥120 billion → ¥135 billion (12.5% increase) - Operating profit margin: 8% → 18% (2.25x) - Customer acquisition cost: 30% reduction through efficiency - Marketing ROI: 1.2x → 3.5x
Segment-Specific Results:
Champions (25,000 people): - Sales: ¥24 billion → ¥31 billion (29% increase) - Annual purchase: ¥960,000 → ¥1,240,000 - VIP program satisfaction: 4.8/5 - Churn rate: Nearly zero
Loyal Customers (125,000 people): - Sales: ¥48 billion → ¥55 billion (15% increase) - Purchase frequency: 8 times/year → 10 times/year - NPS (recommendation score): +65 (industry-leading level)
At Risk (50,000 people): - Rescue success: 60% returned - Sales contribution: ¥5 billion annually (equivalent to new acquisition) - Investment recovery: 5x sales of initiative costs
Hibernating Customers (1,625,000 people): - Investment reduction: Significant cost savings - Partial reactivation: 3% reactivated - Effect: Certain results with low investment
Employee Voices:
Marketing Director (45 years old): "RFM analysis clarified who should receive what. We can now use our limited budget most effectively."
Store Manager (38 years old): "Knowing who premium customers are changed our in-store service. We can make proposals tailored to each person."
Chapter Five: The Detective's RFM Diagnosis—Customers Are Not Equal
Holmes compiled his comprehensive analysis.
"Ms. Johnson, the essence of RFM analysis is 'visualizing customers' true value.' Treating all customers equally appears fair, but is actually inefficient. Identifying and nurturing premium customers is the key to sustainable growth."
Final Report After 24 Months:
RetailMax USA transformed into one of the industry's most profitable companies.
Final Results: - Annual revenue: ¥120 billion → ¥150 billion (25% growth) - Operating profit margin: 8% → 22% (2.75x) - Champions tier: 25,000 → 40,000 (successful cultivation) - Competitive comparison: Top 3 in industry profit margin
The letter from Sarah contained deep gratitude:
"Through RFM analysis, we evolved from 'customer egalitarianism' to 'strategic customer management.' Customers are not equal. By accepting this truth and concentrating investment on premium customers, we built win-win relationships for both customers and ourselves. Now we have an organizational culture that values deep relationships with truly valuable customers."
The Detective's Perspective—The Eye That Discerns Value
That evening, I contemplated the essence of customer value.
The true value of RFM analysis lies in understanding customers through data, not emotion. Behind the beautiful phrase "treat all customers equally," many companies actually neglect premium customers while continuing inefficient investment.
True customer orientation means providing better service to premium customers and deepening those relationships. That ultimately leads to happiness for both company and customers.
"Equality and equity differ. Discerning customer value and allocating resources appropriately. That is true customer orientation."
The next case will also depict the moment when data transforms corporate decision-making.
"Customers are a company's mirror. Only those with eyes to see that mirror correctly achieve true growth."—From the Detective's Notes
Related files

🎖️ Top 3 Weekly Ranking of Classified Case Files
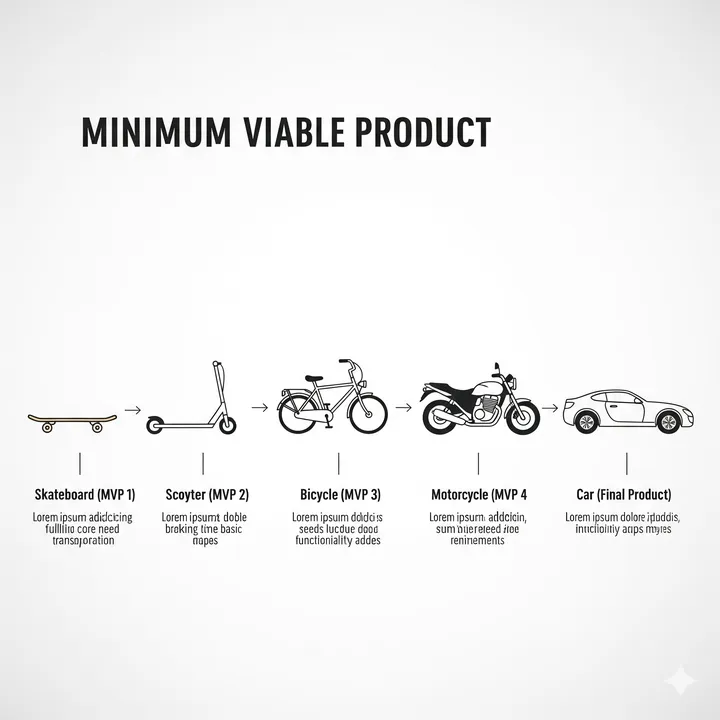
What is MVP
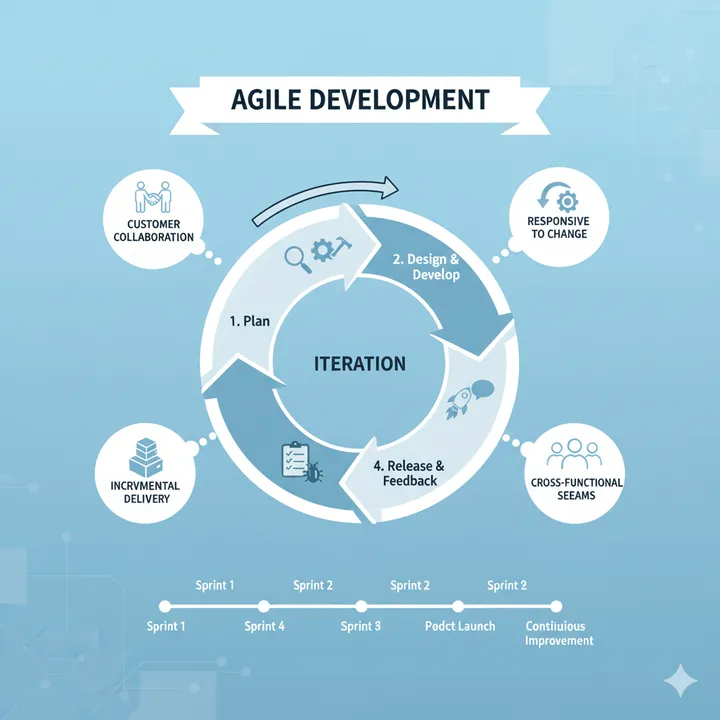
What is Agile Development
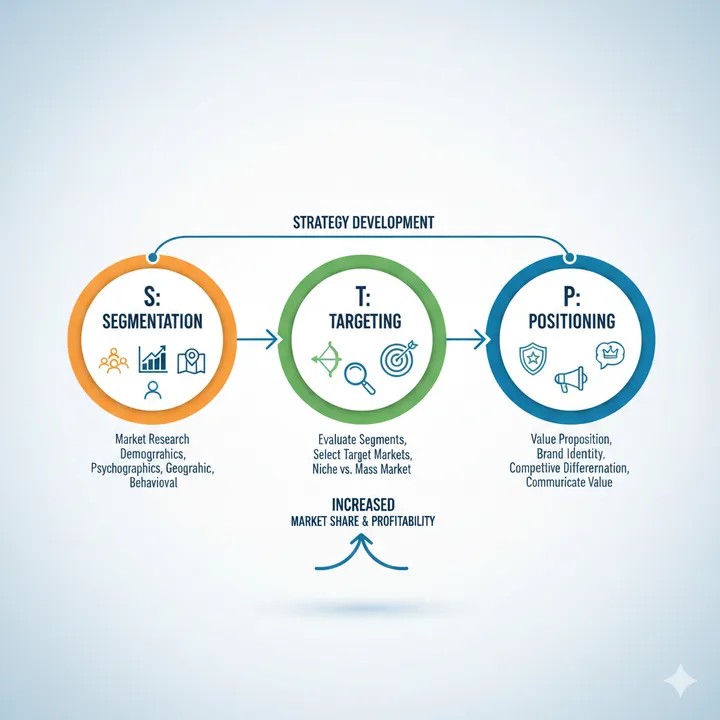
What is STP Analysis