ROI Case File No.271|'NovaEdge Finance's Growth Equation'
📅 2025-10-22 23:00
🕒 Reading time: 8 min
🏷️ AARRR

- Chapter 1: The Ad Spend Incinerator—A Growth Strategy That Doesn't Grow
- Chapter 2: The Pirate Metrics Navigation Chart—AARRR as a Compass
- Chapter 3: Cracks in the Funnel—The Truth the Numbers Tell
- Chapter 4: Filling the Cracks—Stage-by-Stage Optimization
- Chapter 5: The Detective's AARRR Diagnosis—Turning Growth into an Equation
- The Detective's Perspective—Volume 22 "The Pursuit of Reproducibility" Begins
- Related files
Chapter 1: The Ad Spend Incinerator—A Growth Strategy That Doesn't Grow
The week after resolving the Helios Mobility VRIO case, a consultation arrived from North America regarding a fintech startup's growth stagnation. Case File 271, opening Volume 22 "The Pursuit of Reproducibility," is a story about visualizing the entire process from customer acquisition to monetization, making growth reproducible.
"Detective, we're investing 12 million yen monthly in advertising. New users are increasing. However, profits aren't improving at all. We're growing, yet not making money."
Maya Patel, Chief Growth Officer of NovaEdge Finance from San Francisco, visited 221B Baker Street with an exhausted expression. In her hands were graphs showing rising user numbers contrasted sharply with flat revenue graphs.
"We provide a personal asset management app in California. To differentiate from competitors, we've continued increasing ad spend. Users are growing, so why aren't we profitable?"
NovaEdge Finance's Inexplicable Stagnation: - Founded: 2021 (fintech startup) - Monthly new users: 12,000 (via advertising) - Total registered users: 180,000 - Monthly ad spend: 12 million yen - Monthly revenue: 28 million yen - Operating margin: -5% (continued losses)
The numbers showed growth. Yet profitability wasn't improving. Maya's expression held deep anxiety.
"The problem is we can't see the numbers beyond user acquisition. How many people start using the app, how many continue, how many pay. We spend on ads and users increase, but everything beyond that is foggy."
Invisible Growth Structure: - New registrations: 12,000/month (tracked) - App first launch rate: ? - 1-week retention rate: ? - Payment conversion rate: ? - Monthly payment amount: ? - Referral-based new acquisitions: ?
"We're only watching the 'entrance.' Everything beyond that is a complete black box."
Chapter 2: The Pirate Metrics Navigation Chart—AARRR as a Compass
"Maya, how is your current growth strategy being managed with metrics?"
To my question, Maya answered with a bitter expression.
"Basically just 'new user count' and 'total revenue.' In monthly reviews, we check if these two numbers are growing. Other metrics are viewed separately by each department."
Current Metric Management (Fragmented): - Executive team: New user count, total revenue - Marketing: Ad click rate, CPA (cost per acquisition) - Development team: DAU (daily active users), app launches - Customer Success: Inquiry count, satisfaction - Result: Can't see the big picture
I explained the importance of viewing the entire user lifecycle.
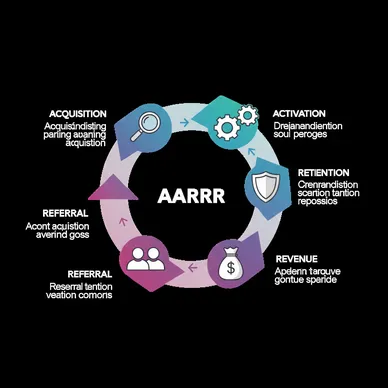
"Growth is a single path. Users are acquired, activated, retained, monetized, and then refer others. Visualizing these five steps is AARRR—the Pirate Metrics."
⬜️ ChatGPT|Catalyst of Concepts
"Acquisition, Activation, Retention, Revenue, Referral. Navigate five straits to reach the treasure"
🟧 Claude|Alchemist of Narratives
"Growth isn't a point, it's a line. Where along that line do people stop?"
🟦 Gemini|Compass of Reason
"AARRR is growth's anatomy. Measure and optimize each funnel stage"
The three members began analysis. Gemini deployed the "Fintech-Specialized AARRR Analysis" framework on the whiteboard.
AARRR (Pirate Metrics) Five Stages: 1. Acquisition - How to acquire users 2. Activation - How to deliver value in first experience 3. Retention - How to keep them using 4. Revenue - How to generate income 5. Referral - How to get them to spread the word
"Maya, let's visualize NovaEdge's growth through these five steps."
Chapter 3: Cracks in the Funnel—The Truth the Numbers Tell
Phase 1: Current AARRR Measurement (2 weeks)
We measured conversion rates at each stage for the first time. The results were shocking.
1. Acquisition: - Monthly new registrations: 12,000 - Average CPA (cost per acquisition): 1,000 yen - Main channels: Facebook ads 60%, Google ads 30%, Organic 10%
2. Activation: - App launch within 24 hours of registration: 42% (5,040 people) - Asset registration completion rate: 18% (2,160 people) - First "value experience" (viewed portfolio diagnosis): 12% (1,440 people)
Shocking truth:
Of 12,000 people, 88% dropped off without experiencing the app's value.
3. Retention: - Active rate after 1 week: 8% (960 people) - Active rate after 1 month: 3% (360 people) - Active rate after 3 months: 1.2% (144 people)
4. Revenue: - Paid plan conversion rate (of total registrations): 0.8% (96 people) - Average monthly payment: 2,900 yen - LTV (customer lifetime value): 8,700 yen (average 3-month retention)
5. Referral: - New registrations via friend referral: 2% (240 people) - Viral coefficient (K-value): 0.02 (1 person refers 0.02 people)
Phase 2: Bottleneck Identification
When we laid out the numbers, clear bottlenecks emerged.
Biggest crack: Activation - 88% of registrants drop off without reaching initial value experience - 880 yen wasted per 1,000 yen spent acquiring users
Calculation: - Monthly ad spend: 12 million yen - Users who actually experienced value: 1,440 - Cost per value-experiencing user: 8,333 yen - Cost per paying conversion: 125,000 yen - LTV: 8,700 yen - Unit economics: -116,300 yen/person loss
Maya turned pale.
"We thought we were acquiring 12,000 people, but actually only acquired 1,440. And that acquisition cost far exceeds LTV."
Chapter 4: Filling the Cracks—Stage-by-Stage Optimization
Phase 3: Activation Improvement Project (3 months)
We concentrated investment on Activation, the biggest bottleneck.
Initiative 1: Onboarding Redesign - Introduced "3-step guide" immediately after registration 1. Bank account linkage (completes in 1 minute) 2. Automatic asset import 3. Instant AI portfolio diagnosis display - Measured and improved completion rate for each step
Initiative 2: Immediate Value Presentation - Previous: Users configure themselves after registration - Improved: Automatically generate "provisional portfolio" upon registration - Effect: Users immediately experience "this is how your assets look"
Initiative 3: Push Notification Optimization - 1 hour after registration: "Your diagnosis is complete" - 24 hours after registration: "We found optimal investments for you" - 3 days after registration: "Want to compare with your age group average?"
Results after 3 months: - Initial value experience rate: 12% → 48% (4x) - Value-experiencing users of acquired: 5,760 (previously 1,440) - Effective CPA: 8,333 yen → 2,083 yen (1/4)
Phase 4: Retention Improvement (implemented in parallel)
We tackled retention rate, the next bottleneck.
Initiative 1: Habit-forming Mechanisms - Every Monday 9am: "Last week's portfolio changes" report - End of month: "This month's asset change summary" - Quarterly: "Goal achievement check"
Initiative 2: Gamification - Continuation day badges (7 days, 30 days, 100 days) - Asset growth rate ranking with friends (anonymized) - Points awarded for completing learning content
Results: - 1-month active rate: 3% → 18% (6x) - 3-month active rate: 1.2% → 12% (10x)
Phase 5: Revenue Optimization
With improved retention, the foundation for monetization was ready.
Initiative: Graduated Value Provision - Free plan: Basic portfolio diagnosis - Light plan (980 yen/month): Detailed analysis and recommendations - Premium (2,900 yen/month): AI-powered automatic rebalancing
Results: - Payment conversion rate: 0.8% → 8.5% (over 10x) - Average retention period: 3 months → 14 months - LTV: 8,700 yen → 34,300 yen (4x)
Phase 6: Referral Design
Finally, we built mechanisms for natural growth through referrals.
Initiative: Referral Incentives - First month free for both referrer and referred - Permanent 10% discount for referring 3 people - Exclusive benefits for top referrers
Results: - Viral coefficient: 0.02 → 0.35 - Referral-based new registrations: 2% → 28% - Reduced advertising dependency
Overall Results after 12 months:
AARRR Overall Improvement: - Acquisition: CPA 1,000 yen → 850 yen (ad efficiency) - Activation: 12% → 48% (4x) - Retention (1 month): 3% → 18% (6x) - Revenue: Conversion 0.8% → 8.5%, LTV 8,700 yen → 34,300 yen - Referral: Viral coefficient 0.02 → 0.35
Business Metrics: - Monthly new registrations: 12,000 → 18,500 (ads + referral) - Monthly revenue: 28 million yen → 92 million yen (3.3x) - Operating margin: -5% → +32% - Unit economics: -116,300 yen → +28,450 yen (profitable)
Chapter 5: The Detective's AARRR Diagnosis—Turning Growth into an Equation
Holmes compiled the comprehensive analysis.
"Maya, the essence of AARRR is 'growth visualization.' Not vaguely wanting 'growth,' but measuring and optimizing each of the five steps. Growth isn't coincidence—it's a reproducible equation."
Final Report after 24 months:
NovaEdge Finance gained attention as a rapidly growing company in the North American fintech market.
Final Achievements: - Total users: 180,000 → 850,000 - Monthly revenue: 28 million yen → 280 million yen (10x) - Operating margin: -5% → +42% - Valuation: 12x from founding
Maya's letter contained deep learning:
"Through AARRR, we transformed from 'a company praying for growth' to 'a company designing growth.' Most important was visualizing not just user acquisition, but the entire process beyond it. Now we review each AARRR metric weekly and make scientific decisions about where to invest. We learned that growth isn't luck—it's reproducible technology."
The Detective's Perspective—Volume 22 "The Pursuit of Reproducibility" Begins
That night, I contemplated the essence of growth.
The true value of the AARRR framework lies in visualizing growth as "a single path." Many companies focus only on acquisition, ignoring what comes after. But true growth is determined not by acquisition, but by the processes that follow.
Activation, retention, monetization, referral. Only when these four steps are optimized does investment in acquisition become meaningful.
Volume 22 "The Pursuit of Reproducibility" is a journey transforming success from coincidence to inevitability. With AARRR as our compass, we head toward the next case.
"Growth isn't magic. It's measurable, improvable, and reproducible science."
The next case will also depict a moment when reproducibility opens a company's future.
"Pirates don't sail without a compass. Businesses can't grow without AARRR"—From the detective's notes
Related files
🎖️ Top 3 Weekly Ranking of Case Files

'QuantumGrocers' Lost Customer Data'

AeroSpray's Vanishing Sales Force'
'GlobalSoft's Drowning Inquiry Response'