ROI Case File No.280|'Printora's B2B Marketing Labyrinth'
📅 2025-10-27 11:00
🕒 Reading time: 9 min
🏷️ AARRR

- Chapter 1: The Consultation Content—Marketing Investment With Invisible Results
- Chapter 2: Five Stages from Awareness to Referral—Visualizing the B2B Funnel
- Chapter 3: Finding Funnel Cracks—The Truth Numbers Tell
- Chapter 4: Stage-by-Stage Optimization—Plugging Funnel Holes
- Chapter 5: The Detective's AARRR Diagnosis—Volume 22 "The Pursuit of Reproducibility" Completion
- The Detective's Perspective—Volume 22 Ends, Next Journey Awaits
- Related files
Chapter 1: The Consultation Content—Marketing Investment With Invisible Results
The week after resolving the Auralis Audio 5W1H case, a consultation arrived from North America regarding a printing service company's marketing strategy. The final case of Volume 22 "The Pursuit of Reproducibility," Case File 280, is a story about visualizing the entire B2B marketing process and making growth scientific.
"Detective, we invest 80 million yen annually in marketing. SEO, trade shows, sales, corporate site renewal. We're doing everything, yet sales aren't growing. We can't see what's working and what isn't at all."
Marcus Thompson, Planning Director of Printora from Chicago, visited 221B Baker Street unable to hide his confusion. In his hands were lists of various marketing initiatives contrasted sharply with flat sales graphs.
"We provide corporate printing services in Illinois. We handle everything from catalogs, brochures, to package printing. But we're not seeing results matching marketing investment."
Printora's Inexplicable Stagnation: - Founded: 2010 (B2B printing services) - Annual revenue: 4.2 billion yen (flat for 3 years) - Marketing budget: 80 million yen annually - Initiative count: 17 initiatives (SEO, trade shows, DM, sales etc.) - New contracts: 48 companies annually (only +2 YoY) - Operating margin: 6% (not improving)
Marcus's expression held deep anxiety.
"The problem is we're not watching between 'marketing activities' and 'sales.' Trade show participation gathers business cards. SEO rankings are rising. Sales are making visits. But nobody can explain how these connect to sales."
Fragmented Marketing Activities: - SEO person: "Search ranking rose to 3rd" - Trade show person: "Gathered 500 business cards" - Web person: "2,000 monthly site visitors" - Sales person: "Making 70 visits monthly" - However: Only 48 new contracts annually (4 monthly)
Numbers Nobody Knows: - Of site visitors, how many inquire? - Of inquiries, how many become negotiations? - Of negotiations, how many contract? - After contract, how many repeat? - Do repeat customers refer others?
"We're only watching marketing 'points,' not seeing the 'line.'"
Chapter 2: Five Stages from Awareness to Referral—Visualizing the B2B Funnel
"Marcus, by what metrics are your current marketing strategies managed?"
To my question, Marcus answered.
"Each person in charge has their own metrics. SEO person has search rankings, trade show person has business card count, sales has visit count. But we're not measuring how these ultimately connect to sales."
Current Metric Management (Partial Optimization): - SEO: Search rankings, organic traffic - Trade shows: Business card count, booth visitors - Web: Monthly visitors, page views - Sales: Visit count, negotiation count - Blind spot: Conversion rates between stages unknown
I explained the importance of viewing the entire customer acquisition process.
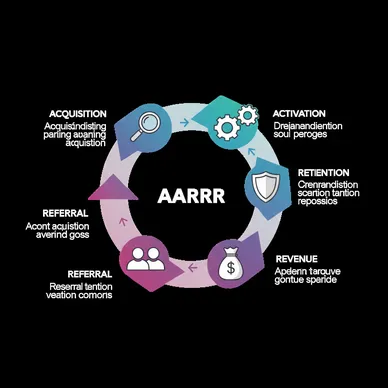
"B2B marketing is a long journey. From awareness to contract, and to continuation and referral. We need to visualize this entire process as a single path. AARRR—B2B version pirate metrics become that map."
⬜️ ChatGPT|Catalyst of Concepts
"Acquisition, Activation, Retention, Revenue, Referral. Measure these 5 stages in B2B too"
🟧 Claude|Alchemist of Narratives
"Marketing is a line, not a point. Where along that line do customers stop?"
🟦 Gemini|Compass of Reason
"AARRR is B2B's navigation chart. Measure and optimize each funnel stage"
The three members began analysis. Gemini deployed the "B2B Printing Industry-Specialized AARRR Analysis" framework on the whiteboard.
B2B Version AARRR (Pirate Metrics) 5 Stages: 1. Acquisition - Awareness, lead acquisition 2. Activation - Initial contact, interest generation 3. Retention - Negotiation, proposal 4. Revenue - Contract, initial transaction 5. Referral - Repeat, referral
"Marcus, let's visualize Printora's marketing through these five stages."
Chapter 3: Finding Funnel Cracks—The Truth Numbers Tell
Phase 1: Current Funnel Measurement (3 weeks)
We collected past 6 months' data and visualized the complete picture for the first time.
1. Acquisition: Monthly Data
By Inflow Channel: - Organic search: 1,200 monthly visits - Via trade shows: 500 monthly business cards (150 site visits) - Sales referrals: 80 monthly - SNS/ads: 220 monthly - Existing customer revisits: 350 monthly - Total: 2,000 monthly visits
2. Activation:
Inquiry Form Submissions: - Of 2,000 monthly visitors - Inquiries: 18 (0.9% conversion)
Initial Negotiation Setup: - Of 18 inquiries - Negotiations: 12 (67% conversion)
3. Retention:
Proposal/Estimate Submission: - Of 12 negotiations - Proposals submitted: 9 (75%)
Negotiation Continuation (2nd+ meetings): - Of 9 proposals - Continued negotiations: 6 (67%)
4. Revenue:
Contract Execution: - Of 6 continued negotiations - Contracts: 4 (67%) - Monthly new contracts: 4 companies
Average Contract Amount: - Initial contract: Average 1.8 million yen
5. Referral:
Repeat Contracts: - Repeat rate within 6 months after contract: 35% - Repeat contract amount: Average 3.2 million yen
Referrals: - Referrals from existing customers: 0.5 monthly (nearly zero)
Phase 2: Bottleneck Identification
Visualizing the entire funnel revealed surprising facts.
Biggest Crack: Activation - 2,000 monthly visitors - 18 inquiries - 0.9% conversion (industry average 3-5%) - Leakage: 1,982 (99.1% leave without action)
Calculation: If conversion improves to industry average 3%: - Inquiries: 18 → 60 (3.3x) - Final contracts: 4 → 13 companies (3.3x) - Monthly sales increase: +16.2 million yen
Second Crack: Referral - Referral rate: Nearly zero - Opportunity loss: If 200 existing customers refer 1 annually, 200 new acquisition opportunities
Marcus turned pale.
"We gathered 2,000 people yet discarded 98.2%."
Chapter 4: Stage-by-Stage Optimization—Plugging Funnel Holes
Phase 3: Activation Improvement Project (2 months)
We concentrated investment on the biggest bottleneck.
Problem Analysis: Why don't visitors inquire?
Visitor Interviews (20 companies): - "Unclear what you print" (12 companies) - "Can't see pricing at all" (15 companies) - "Inquiry form too long" (8 companies) - "Wanted to call but outside business hours" (5 companies)
Improvement Initiatives:
Initiative 1: Site Improvement - Display "printing examples" prominently on top page - Post price guidelines ("A4 catalog 1,000 copies: from 150,000 yen") - Simplify inquiry form to 3 items - Introduce chatbot (24-hour support)
Initiative 2: Free Sample Provision - Add "Free Sample Order" button - Let customers experience printing quality - Lower hurdle: Inquiry → Sample order
Initiative 3: Online Estimate Tool - Install "30-second rough estimate" tool - Just select paper, size, quantity - Display price range instantly
Results after 2 months: - Inquiries/sample orders: 18 → 78 (4.3x) - Conversion rate: 0.9% → 3.9% - Contract rate via free samples: 42% (higher than inquiry route)
Phase 4: Revenue Optimization (parallel implementation)
We executed initiatives to increase contract rate.
Initiative 1: Proposal Standardization - Unified previously scattered sales proposals - Quantify "printing's business impact" - Clearly show examples and track record
Initiative 2: Speed Response - Estimate submission: Average 5 days → Same day - Sample delivery: Average 7 days → 3 days - Initial negotiation: Average 10 days from inquiry → 3 days
Results: - Contract rate: 67% of negotiations → 82% - Order cycle: Average 45 days → 28 days
Phase 5: Referral Design (3 months later)
Finally, we built a growth engine through referrals.
Initiative 1: Thorough Customer Satisfaction Pursuit - Strengthen post-delivery follow-up - Hear about printed material usage status - Support effectiveness measurement ("How many more inquiries after catalog distribution?")
Initiative 2: Referral Incentives - 10% discount on next printing per referral - Referred company also gets 10% initial discount - Win-win design
Initiative 3: Success Story Sharing - Get permission to feature as "○○ company case" - Create industry-specific success story collections - Promote referrals to same industry competitors
Overall Results after 6 months:
AARRR Overall Improvement: - Acquisition: 2,000 monthly visits → 2,850 visits (referral inflow increase) - Activation: Conversion 0.9% → 3.9%, inquiries 18 → 111 - Retention: Negotiation continuation rate improved - Revenue: Contract rate 67% → 82%, monthly contracts 4 → 18 companies - Referral: Referral rate 0% → 28% (28% of existing customers refer 1 annually)
Business Metrics: - Monthly new contracts: 4 → 18 companies (4.5x) - Annual revenue: 4.2 billion yen → 7.8 billion yen (+86%) - Operating margin: 6% → 16% - Marketing ROI: 80 million yen investment for +3.6 billion yen sales (45x)
Customer Acquisition Cost: - Conventional: 80 million yen ÷ 48 companies = 1.67 million yen/company - Improved: 80 million yen ÷ 216 companies = 370,000 yen/company (78% reduction)
Customer Voices:
Manufacturing Marketing Manager: "Received free sample and was amazed by quality. Estimate same-day, fast response. Now order all printed materials from Printora."
Retail Chain PR Manager: "After catalog renewal, store visits increased 23%. Printora also consults on design. Referred 3 competitors in same industry."
Chapter 5: The Detective's AARRR Diagnosis—Volume 22 "The Pursuit of Reproducibility" Completion
Holmes compiled the comprehensive analysis.
"Marcus, the essence of AARRR is 'process visualization.' B2B marketing is a long journey. Measure each stage of that journey, discover bottlenecks, improve. This repetition makes growth reproducible."
Final Report after 12 months:
Printora gained attention as "the fastest-growing company" in the North American printing industry.
Final Achievements: - Annual revenue: 4.2 billion yen → 10.5 billion yen (2.5x) - New contracts: 48 annually → 280 annually (5.8x) - Customer satisfaction: 3.8 → 4.7 - Industry award: "Most Innovative B2B Marketing"
Marcus's letter contained deep gratitude:
"Through AARRR, we transformed from 'an activity-doing company' to 'a results-producing company.' Most important was viewing marketing as a single line. Now we review each AARRR metric weekly and judge where to invest based on data. Growth isn't luck but accumulation of measurement and improvement, we understood."
The Detective's Perspective—Volume 22 Ends, Next Journey Awaits
That night, I contemplated reproducibility's essence.
Volume 22 "The Pursuit of Reproducibility" journeyed through AARRR, Design Thinking, Double Diamond, Value Chain, PEST, LEAN, SWOT, PDCA, 5W1H, and back to AARRR.
Through 10 stories, we arrived at one truth.
Success isn't coincidence. It's reproducible.
- AARRR makes growth measurable
- Design Thinking turns empathy into methodology
- Double Diamond converges chaos
- Value Chain identifies value sources
- PEST decodes external environment
- LEAN eliminates waste
- SWOT chooses battlefields
- PDCA sustains improvement
- 5W1H structures thinking
And common to all these methods are "measurement" and "improvement."
What can't be measured can't be improved.
What can't be improved can't be reproduced.
What can't be reproduced is merely coincidence.
"Reproducibility means making success scientific. And science is repeated measurement and experimentation."
Volume 22 concludes here.
In the next volume, a journey diving into even greater depths awaits.
"Growth isn't magic. It's measured, analyzed, and improved. And that repetition creates miracles"—From the detective's notes
— Volume 22 "The Pursuit of Reproducibility" Complete —
Related files
🎖️ Top 3 Weekly Ranking of Case Files

'QuantumGrocers' Lost Customer Data'

AeroSpray's Vanishing Sales Force'
'GlobalSoft's Drowning Inquiry Response'