ROI Case File No.296 | 'RailNext's Triple Labyrinth'
📅 2025-11-04 11:00
🕒 Reading time: 7 min
🏷️ LOGIC

- Chapter One: Three Timetables—Information Fragmentation, User Confusion
- Chapter Two: Cutting Through Chaos—The Blade Called Logic Tree
- Chapter Three: Dissecting Branches—Decomposing Problems
- Chapter Four: Correcting the Trunk—Unification as Solution
- Chapter Five: Detective's Diagnosis—Structure Visible, Solution Visible
- Related files
Chapter One: Three Timetables—Information Fragmentation, User Confusion
The week after PlayMax's 4P case was resolved, a consultation arrived from Hokuriku regarding a local railway company's information management. Episode 296 of Volume 24 "Proof of Reproducibility" is a story of structuring chaotic information and bundling it into a single trunk.
"Detective, our timetables are in chaos. Station paper timetables, PDFs, official website, transfer apps. The same train information differs slightly by medium. Customer complaints never stop."
Seiichi Nakata, sales planning manager at RailNext, a native of Toyama, visited 221B Baker Street unable to hide his confusion. In his hands were four types of timetables, each with different departure times recorded.
"We operate a local railway in Toyama Prefecture. Three lines, 28 stations. We're a small railway company. But timetable management has become complex and unmanageable."
RailNext's Information Chaos: - Founded: 1965 (local railway) - Lines: 3 - Stations: 28 - Annual users: 4.2 million - Timetable formats: ①Paper (station posting), ②PDF (official site), ③Web version (official site), ④External app integration - Update frequency: 4 times per year (schedule revisions) - Update work time: 320 hours per revision - Information inconsistency inquiries: Monthly average 180 cases
There was deep exhaustion in Nakata's voice.
"The problem is managing the same information separately across four mediums. Each schedule revision requires reprinting paper timetables, recreating PDFs, updating the website, and sending data to external app companies. Mistakes inevitably occur somewhere."
Typical Confusion Case:
Spring 2024 Schedule Revision: - Changed Toyama Station departure 7:35 train to 7:38
Reflection Status by Medium (1 week after revision): - Station paper timetable: 7:38 (correct) - PDF (official site): 7:35 (old data) - Web timetable: 7:38 (correct) - Transfer app: 7:35 (old data)
Result: - Users viewing PDF arrive at 7:35 station → Train already departed - Complaint calls flood in: "Timetable is wrong!" - Response burden: 180 cases monthly
"We understand. We should 'centralize management.' But where to start. The problem is too complex to organize."
Chapter Two: Cutting Through Chaos—The Blade Called Logic Tree
"Mr. Nakata, have you organized the timetable management problems?"
To my question, Nakata gave a bitter smile.
"I can only say everything is a problem. Paper, PDF, Web, app. I can't determine which to prioritize, what to keep and what to discard. The more I think, the more confused I get."
Current Problem Recognition (Chaos): - "Everything is a problem" - "Don't know where to start" - "Can't organize"
I explained the importance of structured thinking.
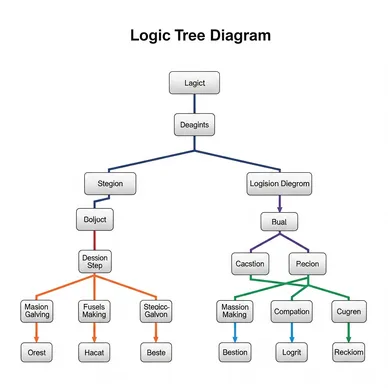
"Don't fear chaos. Logic Tree—decompose big problems into small elements. Then structure them. Organize branches and leaves, and the trunk becomes visible. Correct the trunk, and all branches and leaves are corrected."
⬜️ ChatGPT | Catalyst of Conception
"Chaos isn't the enemy. It's just unstructured. Cut it apart with Logic Tree"
🟧 Claude | Alchemist of Narrative
"Problems seem huge. But decomposed, they're just collections of small elements"
🟦 Gemini | Compass of Reason
"Logic Tree is thinking technology. Decompose with MECE (no omissions, no overlaps), perceive structure"
The three team members began analysis. Gemini deployed the "Logic Tree Framework" on the whiteboard.
Logic Tree Principles: 1. MECE: Mutually Exclusive, Collectively Exhaustive 2. Hierarchization: Decompose big problems into small elements 3. Structuring: Clarify relationships between elements
"Mr. Nakata, let's structure RailNext's timetable problem with Logic Tree."
Chapter Three: Dissecting Branches—Decomposing Problems
Phase 1: First-Level Problem Decomposition (1 week)
We first broadly decomposed the massive "timetable chaos" problem.
Level 1: Decompose by problem type
Timetable Chaos
├── [A] Medium problems (Paper/PDF/Web/App)
├── [B] Issue problems (Convenience/Update cost/Accuracy)
└── [C] Operation problems (Update process)
Nakata's eyes widened.
"Just dividing problems into three organized my mind."
Phase 2: Expansion to Second Level (1 week)
Next, we further decomposed each problem.
[A] Medium Problems Expansion:
[A] Medium Problems
├── A1. Paper Timetables
│   ├── A1-1. Station visibility (○)
│   ├── A1-2. Update cost (×: ¥3M/year for printing/installation)
│   └── A1-3. Update delay (×: 2 weeks needed for printing)
├── A2. PDF
│   ├── A2-1. Downloadable (○)
│   ├── A2-2. Searchability (×: Ctrl+F only)
│   └── A2-3. Update work (×: Manual creation)
├── A3. Web Version
│   ├── A3-1. Real-time update possible (○)
│   ├── A3-2. Search function (△: Limited)
│   └── A3-3. Update work (×: Manual HTML editing)
└── A4. External App Integration
    ├── A4-1. Convenience (○: Transfer guidance)
    ├── A4-2. Data integration (×: Manual CSV sending)
    └── A4-3. Accuracy (×: Integration delays cause inconsistency)
[B] Issue Problems Expansion:
[B] Issue Problems
├── B1. Convenience
│   ├── B1-1. Different usability by medium
│   ├── B1-2. Inconsistent information granularity
│   └── B1-3. Update timing misalignment
├── B2. Update Cost
│   ├── B2-1. Paper printing/delivery: ¥3M/year
│   ├── B2-2. PDF creation: 40 hours/revision
│   ├── B2-3. Web update: 60 hours/revision
│   └── B2-4. App data transmission: 20 hours/revision
└── B3. Accuracy
    ├── B3-1. Manual input errors
    ├── B3-2. Medium transfer errors
    └── B3-3. Update omissions
[C] Operation Problems Expansion:
[C] Operation Problems
├── C1. No centralized data management
│   └── C1-1. Managed separately across 4 mediums
├── C2. Update Flow
│   ├── C2-1. Paper: Design→Print→Delivery
│   ├── C2-2. PDF: Excel→PDF conversion→Upload
│   ├── C2-3. Web: Excel→HTML manual entry→Publish
│   └── C2-4. App: Excel→CSV conversion→Email send
└── C3. Dispersed Responsibility
    ├── C3-1. Paper: General Affairs
    ├── C3-2. PDF: Sales Planning
    ├── C3-3. Web: Information Systems
    └── C3-4. App: External outsourcing
Phase 3: Root Cause Identification
Looking at the Logic Tree revealed one truth.
Root of All Problems: C1 "No Centralized Data Management"
Nakata gasped.
"I see... Paper, PDF, Web, and app were all created from 'separate Excel files.' That's why fixing one doesn't fix others. The roots are separate, so branches can't unify."
Chapter Four: Correcting the Trunk—Unification as Solution
Phase 4: Solution Logic Tree (1 month)
Structuring the problem enabled structuring solutions.
Solution Hierarchy:
Timetable Centralization
├── [Solution 1] Common Database Construction
│   ├── 1-1. Train basic information (line/station/time)
│   ├── 1-2. Fare information
│   └── 1-3. Operation information (delays/suspensions)
├── [Solution 2] Automatic Output System
│   ├── 2-1. Paper PDF automatic generation
│   ├── 2-2. Web version automatic update
│   └── 2-3. App integration API
└── [Solution 3] Unified Update Flow
    ├── 3-1. Consolidate responsibility to Sales Planning
    ├── 3-2. All mediums reflect with database update only
    └── 3-3. Digitize approval flow
Investment Decision: - System development cost: ¥18 million - Annual maintenance: ¥2.4 million - Payback period: 2.4 years (printing cost reduction + work time reduction)
Phase 5: System Construction and Operation Start (6 months)
New System "RailNext Integrated Timetable DB":
Mechanism: 1. Sales Planning inputs timetable into DB (once only) 2. Paper PDF automatically generated 3. Web version automatically updated 4. App integration API automatically provides data 5. All mediums update simultaneously
Results After 6 Months:
Dramatic Update Work Time Reduction: - Previous: 320 hours per revision (4 people × 10 days) - New system: 18 hours per revision (1 person × 2 days) - Reduction rate: 94%
Cost Reduction: - Paper printing: ¥3M/year → ¥1.8M/year (40% reduction, printing data creation streamlined through data integration) - Work cost reduction: 1,200 hours annual reduction - Total reduction: ¥7.2M annually
Accuracy Improvement: - Information inconsistency: 180 cases monthly → 2 cases (99% reduction) - User satisfaction: 3.2 → 4.6 - Complaint calls: 180 monthly → 8 monthly
Organizational Change: - Timetable management: 4 departments dispersed → Consolidated to Sales Planning - Schedule revision burden: "Hell" → "Complete in half day" - Time for other tasks: 1,200 annual hours allocated to customer service
Phase 6: External Value Provision (After 12 months)
Using centralized data, deployed new services.
New Service: "Real-time Operation Information API" - Provides delay/suspension information to external apps in real-time - Monthly fee: ¥50,000 per company - Contract companies: 6 (transfer apps, tourism sites, etc.) - Annual revenue: ¥3.6 million
Regional Contribution: - Cooperation with tourism association: Provide timetable data to tourism sites - Community evaluation: "Railway company with high information transparency"
Chapter Five: Detective's Diagnosis—Structure Visible, Solution Visible
That night, I reflected on Logic Tree's essence.
People fear chaos. When problems are complexly intertwined, they give up saying "can't be handled."
But Logic Tree doesn't fear chaos. It cuts big problems into small pieces and structures them. Then it becomes visible that all branches grow from a single trunk.
RailNext's timetable problem also initially seemed "everything is a problem." But decomposed, the root cause was the single point of "no centralized data management." Correct the trunk, and all branches are corrected.
"Don't fear chaos. Structure it. Logic Tree illuminates the maze's exit."
The next case will also depict the moment when Logic Tree transforms complexity into simplicity.
"Trimming branches doesn't solve problems. Perceive the trunk, correct the trunk. Logic Tree gives structure to chaos"—From the detective's notebook
Related files
🎖️ Top 3 Weekly Ranking of Classified Case Files

What is the RICE Framework
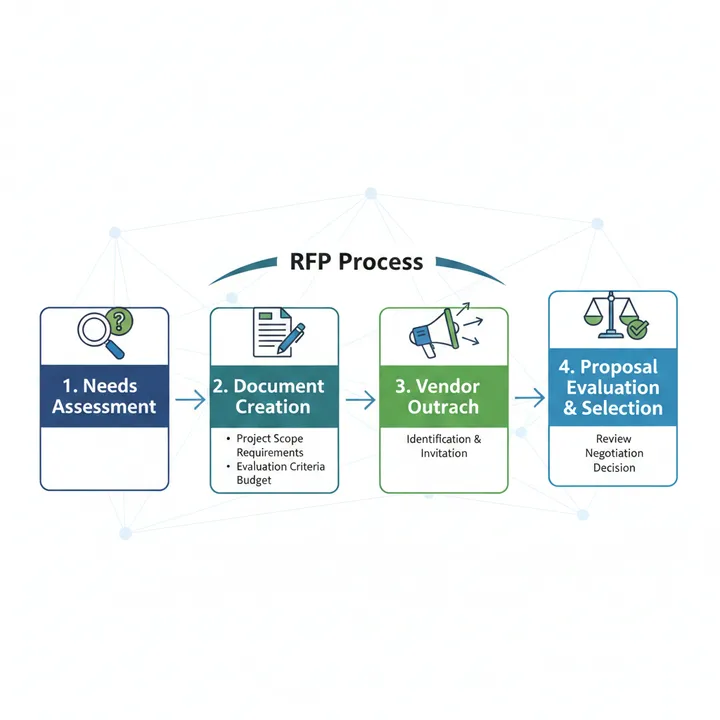
What is RFP
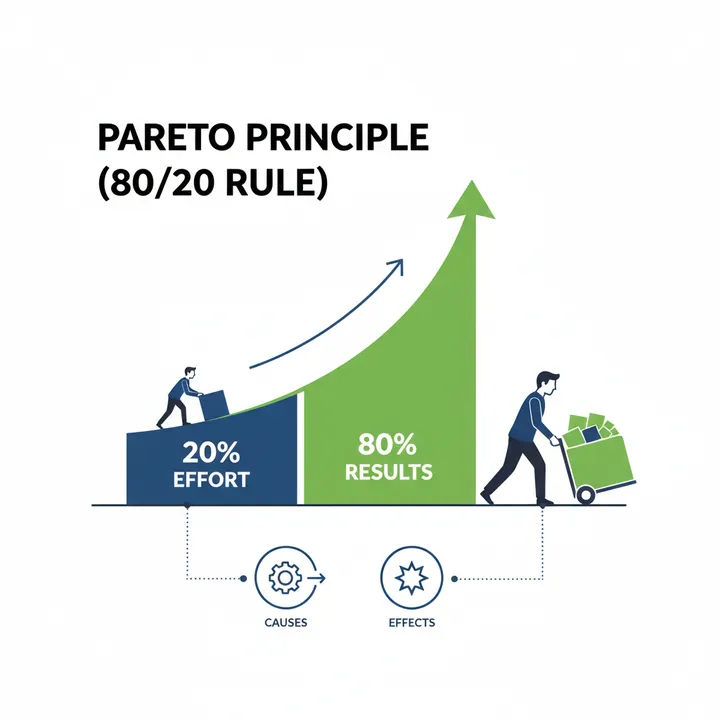
What is the Pareto Principle
Solve Your Business Challenges with Kindle Unlimited!
Access millions of books with unlimited reading.
Read the latest from ROI Detective Agency now!
*Free trial available for eligible customers only