ROI Case File No.315 | 'MDF's Invisible Customers'
📅 2025-11-13 23:00
🕒 Reading time: 10 min
🏷️ SWOT

- Chapter 1: The Illusion of Data—Numbers Exist, But Nothing Is Visible
- Chapter 2: The Blind Spot of Fragmentation—Why Strengths Aren't Visible
- Chapter 3: The Square Mirror—Honest Assessment as the Starting Point
- Chapter 4: The Vision of Integration—One Picture Changes Decision-Making
- Chapter 5: The Power of Visualization—Organizational Change After 12 Months
- Chapter 5: The Detective's Diagnosis—Acknowledging Weakness Becomes Strength
- Related Files
Chapter 1: The Illusion of Data—Numbers Exist, But Nothing Is Visible
The week after Koike's LOGIC case was resolved, a consultation arrived from Tokyo regarding customer analysis at an outsourcing company. Case File 315 of Volume 26, "The Pursuit of Reproducibility," tells the story of integrating scattered data and honestly examining strengths and weaknesses.
"Detective, we have customer data. EC site, call center, stores... each has massive amounts of data. However, it's not integrated. We don't know 'which customers are most valuable' or 'why they don't repeat.' We have data, but we can't see anything."
Misaki Fujita, Marketing Manager of MDF Solutions Co., born in Minato Ward, visited 221B Baker Street unable to hide her confusion. In her hands were bundles of customer data output from 3 systems and, in stark contrast, executive meeting materials marked "analysis impossible."
"We provide outsourcing services to companies in Tokyo. Call center operations, data entry, administrative work... we handle various tasks. And we also run an online shop. We sell stationery and office supplies."
MDF's Customer Data Fragmentation: - Established: 2010 (BPO services) - Annual Revenue: 2.8 billion yen (online shop: 600 million yen) - Customer Count: EC 18,000 people, via call center 5,000 people, stores 2,000 people - Data Management: Managed separately in 3 systems - Problem: Can't see complete customer picture, can't implement repeat strategies
Fujita's voice carried deep anxiety.
"The problem is that the same customer may be purchasing through multiple channels, but we don't know. A customer who purchased on EC might also be purchasing via call center. But systems are separate, so we can't link them. Customer IDs, email addresses, phone numbers... nothing is unified."
Typical Example of Data Fragmentation:
Customer A (same person in reality):
EC Site Records: - Customer ID: EC-10234 - Name: Hanako Sato - Email: hanako.sato@example.com - Purchase History: Stationery set (2,800 yen, 6 months ago) - Repeat: None
Call Center Records: - Customer ID: CC-5678 - Name: Satou Hanako - Phone: 090-1234-5678 - Inquiry: "EC order delivery delay" - Purchase History: No record (EC information not visible)
Store Records: - Customer ID: ST-9012 - Name: Sato Hanako - Purchase History: 3 notebooks (1,200 yen, last week)
Same person recorded as different people in 3 systems
Fujita sighed deeply.
"Customer A might actually be a premium customer. She purchased 4,000 yen total across EC, call center, and store. But in our system, she only appears as 'someone who bought once on EC.' She's excluded from repeat strategy targets. How many customers like this are there...?"
Chapter 2: The Blind Spot of Fragmentation—Why Strengths Aren't Visible
"Fujita-san, how is customer analysis currently conducted?"
To my question, Fujita answered.
"Each department analyzes independently. EC department analyzes 'EC customer purchase history.' Call center department analyzes 'inquiry content.' Store department analyzes 'visit frequency.' But we can't do cross-sectional analysis. We don't have the budget or time to integrate."
Current Approach (Department-by-Department Analysis Type): - Analysis: Each department conducts independently - Problem: Can't see complete customer picture - Result: Can't grasp strengths or weaknesses
I explained the importance of honestly examining one's current state.
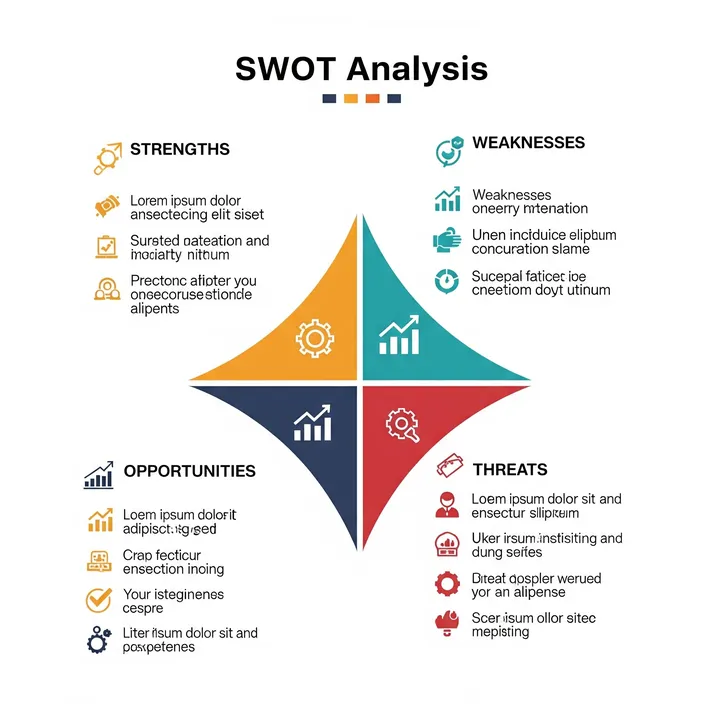
"To leverage strengths, you first need to know your weaknesses. SWOT analysis—Strength, Weakness, Opportunity, Threat. Internal and external, good and bad. If you organize the current state in these 4 quadrants, you'll see what moves to make."
⬜️ ChatGPT | Catalyst of Conception
"Before talking about strengths, face your weaknesses. Cut reality into squares with SWOT."
🟧 Claude | Alchemist of Narrative
"Visualization means building a bridge between reality and ideals. Acknowledging weakness is the first step."
🟦 Gemini | Compass of Reason
"SWOT is the technology of current state assessment. Find strategic starting points through the 4 quadrants of Strength, Weakness, Opportunity, Threat."
The three members began their analysis. Gemini unfolded the "SWOT Framework" on the whiteboard.
SWOT's 4 Quadrants:
Internal Factors:
- Strength: Company advantages
- Weakness: Company challenges

External Factors:
- Opportunity: External opportunities
- Threat: External risks
"Fujita-san, let's organize MDF's current state with SWOT."
Chapter 3: The Square Mirror—Honest Assessment as the Starting Point
Phase 1: SWOT Analysis Workshop (1 week)
We gathered 20 people—executives and department heads—for a SWOT workshop.
Rules: - Each person writes "strengths," "weaknesses," "opportunities," and "threats" on sticky notes - Stick them on whiteboard and group - Consolidate duplicates and prioritize
Strength:
- Abundant customer history data (Mentions: 15 people)
- EC: 18,000 people, Call center: 5,000 people, Stores: 2,000 people
-
Past 5 years of purchase history, inquiry history
-
Customer touchpoints across multiple channels (12 people)
- 3 channels: EC, call center, stores
-
High customer contact frequency
-
BPO business know-how (10 people)
- Data processing and analysis technical capabilities
-
Track record of supporting other companies' data analysis
-
Customer trust (8 people)
- High inquiry response satisfaction (4.2/5)
Weakness:
- Lack of system integration (Mentions: 18 people)
- EC, call center, store data not integrated
-
Cannot identify same customer
-
Different KPIs by department (14 people)
- EC: sales, Call center: response volume, Stores: visit count
-
Cannot compare company-wide results
-
Repeat customer analysis is person-dependent (11 people)
- Depends on staff experience and intuition
-
Cannot make data-driven decisions
-
Unclear where to start improvements (9 people)
- Cannot prioritize improvements
Fujita nodded deeply.
"'Lack of system integration' is the biggest weakness. 18 people pointed it out."
Opportunity:
- Potential for data-driven initiatives (Mentions: 12 people)
- Industry-wide data utilization progressing
-
Can differentiate with BI implementation
-
Omnichannel strategy possibilities (10 people)
- Integrating EC, call center, stores improves customer experience
-
Cross-sell and upsell opportunities
-
Competitor lag (8 people)
- Competitors also lack data integration
- Can gain advantage by being first
Threat:
- Accelerating customer churn (Mentions: 11 people)
- Repeat rate declining trend (-8% YoY)
-
Customer outflow due to competitor EC strengthening
-
Lack of data analysis talent (9 people)
- No data scientists in-house
- High cost to outsource
Phase 2: SWOT Analysis Integration and Prioritization (3 days)
We integrated the 4 quadrants and derived strategies.
Cross-SWOT Analysis:
【Strength × Opportunity】
- Abundant data × Data-driven initiatives
  → Realize omnichannel strategy with data integration and BI implementation

【Strength × Threat】
- Multiple channels × Customer churn
  → Visualize customers across channels, strengthen repeat initiatives

【Weakness × Opportunity】
- Lack of system integration × Omnichannel
  → System integration is top priority

【Weakness × Threat】
- Analysis person-dependency × Data talent shortage
  → Eliminate person-dependency with BI tool implementation
Conclusion: "Data integration + BI implementation" is top priority theme
Phase 3: Data Integration Project Launch (1 month)
We started a project based on SWOT analysis results.
Project Goal: Build cross-departmental customer analysis infrastructure and create unified decision-making picture
Investment: - Customer Data Platform (CDP): 12 million yen - BI Tool (Tableau): 1.8 million yen annually - Data migration and cleansing: 5 million yen - Total: 18.8 million yen
Chapter 4: The Vision of Integration—One Picture Changes Decision-Making
Phase 4: Data Integration Implementation (3 months)
We integrated data from 3 systems into CDP.
Integration Rules: - Customer identity determination: Match by email, phone number, name (handle variations) - Assign unified customer ID: "MDF-XXXXX" - Purchase history integration: Combine all EC, call center, store purchases
After 3 months:
Before Integration: - EC customers: 18,000 people - Call center customers: 5,000 people - Store customers: 2,000 people - Total: 25,000 people (before deduplication)
After Integration: - Actual customer count: 16,800 people - Discovery: 8,200 people (33%) were purchasing through multiple channels
Customer A (opening example) after integration:
Unified Customer ID: MDF-10234
Name: Hanako Sato
Email: hanako.sato@example.com
Phone: 090-1234-5678

Purchase History:
- EC Site: Stationery set (2,800 yen, 6 months ago)
- Store: 3 notebooks (1,200 yen, last week)
- Total: 4,000 yen

Inquiry History:
- Call center: Delivery delay (6 months ago)

Customer Rank: Premium customer (multi-channel user)
Fujita was shocked.
"Customer A wasn't 'someone who bought once' but 'a premium customer who purchases through multiple channels'..."
Phase 5: BI Dashboard Construction (1 month)
We visualized integrated data with BI tool.
Executive Dashboard (Tableau):
KPI 1: Customer Value Visualization - Customer LTV (lifetime value) ranking - Revealed: Top 10% of customers generate 52% of sales
KPI 2: Cross-Channel Analysis - Single-channel users: 11,600 people (average LTV 3,200 yen) - Multi-channel users: 5,200 people (average LTV 18,400 yen) - Discovery: Multi-channel users' LTV is 5.75 times higher
KPI 3: Repeat Rate Visualization - Single-channel user repeat rate: 18% - Multi-channel user repeat rate: 62%
KPI 4: Churned Customer Analysis - Top 3 churn reasons: 1. Delivery delays (28%) 2. Product out of stock (22%) 3. Price (18%)
Phase 6: Initiative Execution (3 months)
We executed initiatives based on integrated data and BI.
Initiative 1: Promoting Multi-Channel Usage - Send store visit coupons to EC purchasers - Offer EC first-purchase discount to store purchasers - Result: Multi-channel users 5,200 people → 7,800 people (+50%)
Initiative 2: Special Treatment for Top 10% Customers - Assign dedicated staff to VIP customers (top 10% LTV) - Advance notice of new products, birthday presents - Result: VIP customer annual purchase amount +32%
Initiative 3: Churn Prevention Initiatives - Automatic follow-up email + coupon when delivery delays - Back-in-stock notifications - Result: Churn rate 12% → 7% (42% reduction)
Chapter 5: The Power of Visualization—Organizational Change After 12 Months
Results After 12 Months:
Financial Results: - Online shop sales: 600 million yen → 840 million yen (+40%) - Customer LTV: Average 5,800 yen → Average 9,200 yen (+59%) - Repeat rate: 18% → 38% (+111%) - Investment recovery period: 8.9 months
Organizational Change:
Decision-Making Beyond Departmental Walls: - Weekly executive review of integrated dashboard - Evaluate by company-wide LTV instead of departmental KPIs - EC, call center, and store departments collaborate
Fujita's Reflection:
"Until we did SWOT analysis, we thought 'we have data.' But actually, we only had 'scattered data.'
By facing our weaknesses, we understood that 'lack of system integration' was the biggest challenge. And to solve it, we decided on data integration and BI implementation.
Now, when asked in executive meetings 'How's this customer segment?', I can answer immediately with the dashboard. With data in one picture, decision-making speed became 10 times faster."
Executive Evaluation:
President: "Previously, each department reported 'our sales increased,' 'our visit count increased.' But company-wide sales weren't growing. Because we were counting the same customers multiple times.
After integration, we learned the actual customer count was 16,800, not 25,000. And we learned that multi-channel users generate 52% of LTV.
Because we had this 'one picture,' we could concentrate investment on multi-channel promotion initiatives."
Chapter 5: The Detective's Diagnosis—Acknowledging Weakness Becomes Strength
That night, I contemplated the essence of SWOT.
MDF had data. But it was scattered. They couldn't leverage strengths because they couldn't see weaknesses.
By organizing the current state into 4 quadrants with SWOT analysis, the truth became visible. "Lack of system integration" as a weakness was the biggest challenge. And solving it was the first step to leveraging the strength of "abundant data."
"Before talking about strengths, face your weaknesses. SWOT cuts reality into squares and illuminates the next move."
The next case will also depict the moment when SWOT organizes the current state.
"To leverage strengths, first know your weaknesses. Survey internal and external with SWOT analysis. One picture transforms the organization"—From the Detective's Notes
Related Files
🎖️ Top 3 Weekly Ranking of Classified Case Files
What is ROI
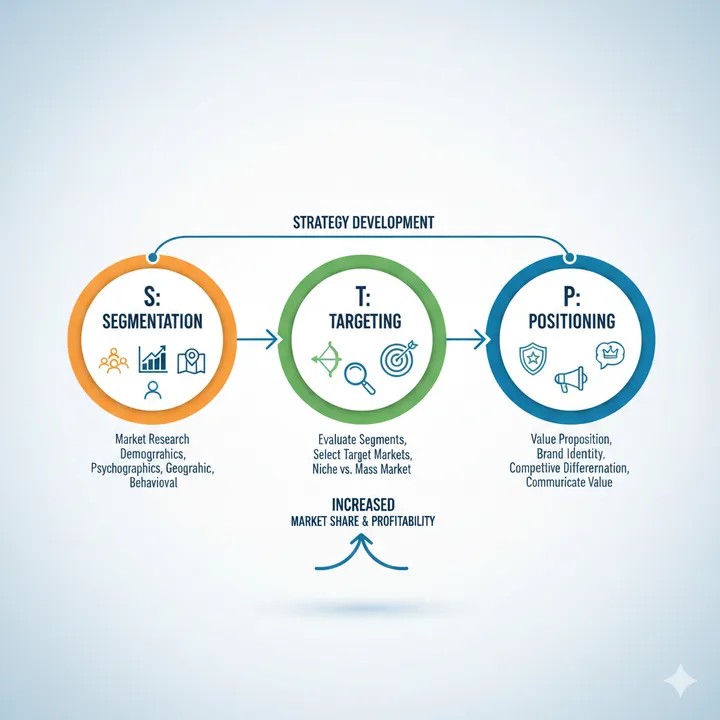
What is STP Analysis

What is the RICE Framework