ROI Case File No.326 | 'Empathy Design's Invisible Emotions'
📅 2025-11-19 11:00
🕒 Reading time: 10 min
🏷️ EMPATHY

- Chapter 1: The Wall of Data—Numbers Hide Emotions
- Chapter 2: The Limits of Questions—Emotions Can't Be Asked
- Chapter 3: Discovery Through Observation—Following Emotional Flow
- Chapter 4: Design Through Empathy—UI Responding to Emotions
- Chapter 5: The Power of Empathy—Organizational Change After 12 Months
- Chapter 6: The Detective's Diagnosis—Emotion as a Map
- Related Files
Chapter 1: The Wall of Data—Numbers Hide Emotions
The week after the Matrix Vision 6D Matrix case was solved, a consultation arrived from Tokyo regarding customer understanding at a UX design company. Episode 326 of Volume 27, "The Pursuit of Reproducibility," tells the story of visualizing emotions hidden behind quantitative data.
"Detective, we conduct surveys of over 500 customers monthly. Satisfaction, usage frequency, improvement requests... We collect vast amounts of data. However, from that data we can't see 'why customers feel that way.' Numbers accumulate, yet we don't understand customers' hearts."
Misaki Kimura, Customer Experience Director at Empathy Design, a Meguro native, visited 221B Baker Street unable to hide her confusion. In her hands were detailed survey tabulation sheets and, in stark contrast, product development meeting minutes marked "customer psychology unknown."
"We support UX design for web services in Tokyo. Founded 6 years ago. We improve usability of client company websites and apps to enhance customer experience—that's our business. However, recently, our improvement proposal accuracy has declined."
Empathy Design's Customer Understanding Wall: - Established: 2019 (UX design consulting) - Annual revenue: ¥800M - Staff: 32 (UX Designers 18, Researchers 8, Sales 6) - Monthly survey responses: Average 500 - Customer satisfaction survey: 100% implementation rate - Problem: Rich quantitative data but can't read emotional background
Deep anxiety filled Kimura's voice.
"The problem is that survey results 'scatter.' For the same question, some answer 'satisfied,' others 'dissatisfied.' Averaging yields 'average.' But from that average, nothing is visible. Why satisfied, why dissatisfied... We don't understand that background."
Typical Survey Results:
Question: "Was this website easy to use?"
| Response | Percentage |
|---|---|
| Very satisfied | 18% |
| Satisfied | 32% |
| Average | 28% |
| Dissatisfied | 15% |
| Very dissatisfied | 7% |
Average score: 3.4/5
Kimura: "3.4 points... Is this good or bad? And why are 18% 'very satisfied' while 7% are 'very dissatisfied'? What creates this difference?"
Product Development Meeting Discussion:
UX Designer A: "Looking at survey results, satisfaction is 3.4 points. Improvement needed."
Researcher B: "Looking at free response section, many opinions say 'hard to understand.' Let's improve navigation."
UX Designer C: "But 'hard to understand'—specifically what? Which screen? Which operation? Without knowing that, we can't improve."
Researcher B: "Free responses say 'top page hard to see.'"
UX Designer C: "Hard to see... meaning? Color? Font? Layout?"
Researcher B: "...It doesn't go that far."
Discussion spins without progress
Another Project:
Client Company D (EC site operation): "We commissioned you to improve product page UI. However, purchase rate didn't increase. Why?"
Kimura: "In surveys, 82% said 'became easier to see.' Design is improved."
Company D: "But it doesn't sell. Easy to see, but doesn't make them want to buy. What's this difference?"
Kimura: "...We apologize. We'll re-investigate."
Kimura sighed deeply.
"We're improving 'visibility' and 'usability.' Surveys show high ratings. But that doesn't lead to purchasing or behavior. We understand 'how customers feel,' but can't see 'why they feel that way' or 'what makes them act.'"
Chapter 2: The Limits of Questions—Emotions Can't Be Asked
"Ms. Kimura, what kinds of questions comprise your current surveys?"
To my question, Kimura answered.
"We have satisfaction rated on 5-point scale. 'Usability?' 'Design?' 'Information clarity?'... Each on 5 points. Finally there's a free response section. 'Please tell us if there are points you'd like improved.'"
Current Approach (Quantitative Survey Type): - Method: Survey research, 5-point evaluation - Problem: Can't capture emotional fluctuations or background - Result: Averages emerge but improvement measures invisible
I explained the importance of visualizing emotions.
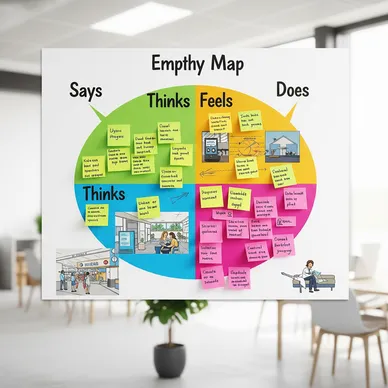
"Customers can 'answer' questions, but are poor at 'explaining emotions.' EMPATHY Map—what customers see, hear, and feel. If we visualize this emotional flow, reasons for behavior become visible."
⬜️ ChatGPT | Concept Catalyst
"Don't ask questions, observe. Draw emotion maps with EMPATHY Map."
🟧 Claude | Story Alchemist
"It begins not with understanding, but with feeling. Empathy is a designable element."
🟦 Gemini | Compass of Reason
"EMPATHY is emotion analysis technology. Describe customers from 4 perspectives: See, Hear, Feel, Say."
The three members began analysis. Gemini deployed the "EMPATHY Map Framework" on the whiteboard.
EMPATHY Map's 4 Quadrants:
┌─────────────┬─────────────┐
│  What See?  │  What Hear? │
│   (See)     │   (Hear)    │
├─────────────┼─────────────┤
│ What Feel?  │  What Say?  │
│   (Feel)    │   (Say/Do)  │
└─────────────┴─────────────┘
Four Perspectives: 1. See: What customers visually experience 2. Hear: What customers hear (information, surrounding voices) 3. Feel: Customers' internal emotions (anxiety, expectations, irritation) 4. Say/Do: Words and actions customers actually express
"Ms. Kimura, let's describe Empathy Design's customers with EMPATHY Map."
Chapter 3: Discovery Through Observation—Following Emotional Flow
Phase 1: Customer Observation (4 weeks)
We observed actual usage scenes, not surveys.
Observation Target: 30 customers of Company D (EC site operation)
Observation Method: - Observed product browsing scenes at home via Zoom screen sharing - Requested "please say what you're thinking aloud" (Think Aloud method) - Recorded facial expressions, hesitation, click hesitation
Customer A (35, female, office worker) Observation:
Scene 1: Searching for Products (8 PM, at home)
See: - Opens Company D's EC site top page - 10 product categories lined up - Sale information banner flashing at top of screen
Hear: - Notification sound from smartphone SNS - Husband's voice calling "Dinner's ready"
Feel: - "Haven't decided what to buy... guess I'll just look" (hesitation) - "Says sale, but is it really cheap?" (doubt) - "If I don't hurry, dinner will get cold" (anxiety)
Say/Do: - "Hmm..." (voice of indecision) - Clicks category but presses back button after 5 seconds - Says "I'll do it later" and closes site
Result: Left without purchasing
Customer B (28, male, self-employed) Observation:
Scene 1: Viewing Product Page
See: - Product image small, can't see details - 500 reviews but only average stars displayed - "Only 3 items in stock" displayed in red
Hear: - (Nothing particular, quiet environment)
Feel: - "Image is small... can I enlarge it?" (irritation) - "500 reviews—is that good or bad?" (doubt) - "3 items in stock... really? Trying to rush me?" (distrust)
Say/Do: - "Can't trust this..." (muttering) - Begins searching for same product on other sites - Closes Company D's site
Result: Left to competitor site
Phase 2: EMPATHY Map Creation (1 week)
Integrated observation results from 30 people and created EMPATHY Map.
Typical Customer's EMPATHY Map:
┌────────────────────┬────────────────────┐
│ See                │ Hear               │
│・Product image small│・Family calling    │
│・Too much info     │・SNS notifications │
│・Sale banner flash │・(Quiet environ.)  │
│・Stock warning     │                    │
├────────────────────┼────────────────────┤
│ Feel               │ Say/Do             │
│・Hesitation (what  │・"Hmm..."          │
│  to buy)           │・Go between        │
│・Doubt (really     │  categories        │
│  cheap?)           │・Leave quickly     │
│・Anxiety (no time) │・Search other sites│
│・Irritation (hard  │                    │
│  to see)           │                    │
│・Distrust (stock)  │                    │
└────────────────────┴────────────────────┘
Emotional Flow (Storyboarded):
1. Hesitation → "Haven't decided what to buy"
2. Doubt → "Is sale really a good deal?"
3. Irritation → "Image small, info hard to see"
4. Distrust → "3 in stock—really? Rushing me?"
5. Anxiety → "No time, I'll do it later"
6. Leave → "Never mind"
Discovery:
Kimura was shocked.
"Customers answered 'easy to see' on surveys. But actually, emotions of 'hesitation,' 'doubt,' 'irritation,' 'distrust,' and 'anxiety' were swirling. And those emotions created departure."
Chapter 4: Design Through Empathy—UI Responding to Emotions
Phase 3: Emotion-Responsive UI Design (2 months)
We designed responses to emotions revealed by EMPATHY Map one by one.
1. Hesitation → Response to "Haven't decided what to buy":
Before: - Only 10 categories lined up
After: - Installed "If Unsure, Click Here" button on top page - Click leads to simple questions (3 questions) - "Gift for whom?" → Self/Family/Friends - "Budget?" → ~¥3,000/~¥5,000/~¥10,000 - "What mood?" → Want healing/Want energy/Want learning - Display 3 recommended products according to answers
Effect: Reduced hesitation time
2. Doubt → Response to "Is sale really a good deal?":
Before: - Only "On Sale!" banner display
After: - Display past price trend graph - Specifically state "15% cheaper than last month" - Display "Lowest price compared to other sites" (with price comparison site link)
Effect: Dispelled doubt
3. Irritation → Response to "Image small, info hard to see":
Before: - Product image small, doesn't enlarge on click - Reviews only show star average
After: - Display product image large, auto-enlarge on hover - Reviews automatically extract 3 "good points" and "bad points" each - Prioritize "reviews from people with same concerns"
Effect: Resolved irritation
4. Distrust → Response to "3 in stock—really?":
Before: - "Only 3 items left!" displayed in red
After: - Removed stock display - Instead display "Shipping estimate: next day" - Emphasize trustworthiness with "Over 100 people purchased"
Effect: Converted distrust to trust
5. Anxiety → Response to "No time, I'll do it later":
Before: - Products viewed disappear once leaving site
After: - Installed "View Later" button - Bookmark function allows easy return later - Email notification "Product you viewed still in stock"
Effect: Converted anxiety to "can safely return later"
Phase 4: Post-Improvement Effect Measurement (3 months)
Implemented new UI on Company D's EC site.
Results After 3 Months:
| Metric | Before | After | Change |
|---|---|---|---|
| Purchase rate | 2.8% | 4.6% | +64% |
| Cart abandonment | 68% | 48% | -29% |
| Avg. stay time | 3:20 | 5:40 | +69% |
| Return visit rate | 18% | 35% | +94% |
Customer Satisfaction: - Before: 3.4/5 - After: 4.5/5
Chapter 5: The Power of Empathy—Organizational Change After 12 Months
Results After 12 Months:
Empathy Design's Changes:
Project Success Rate: - Before: 62% (no effect even with UI improvement) - After: 88% (effect emerges from design responding to customer emotions)
Client Count: - Before: 24 companies - After: 38 companies (+58%) - Reason: "Empathy-based UX design" gained reputation
Annual Revenue: - Before: ¥800M - After: ¥1.1B (+38%)
Kimura's Summary:
"Before using EMPATHY Map, we only looked at 'data.' Satisfaction 3.4 points, purchase rate 2.8%... We understood numbers, but didn't understand 'why those numbers emerged.'
Visualizing customer emotions with EMPATHY Map revealed truth. Customers viewed sites amid emotions of 'hesitation,' 'doubt,' 'irritation,' 'distrust,' and 'anxiety.' And those emotions obstructed purchasing.
Data tells us 'what happened,' but emotions tell us 'why it happened.' We began designing in response to emotional flow, not data.
Empathy is a designable element. What customers see, hear, feel, and say. Observing from these four perspectives makes reasons for behavior visible."
UX Designer Voices:
UX Designer A: "Previously, I thought creating 'easy-to-see design' was sufficient. But easy-to-see alone was insufficient. Design responding to customer emotions was necessary. Using EMPATHY Map enabled design thinking: 'for this emotion, respond with this UI.'"
Researcher B: "Previously, I only reported survey tabulation results. 'Satisfaction 3.4 points.' But that conveyed nothing. Now, I report drawing emotional flow with EMPATHY Map. Then designers immediately provide improvement ideas."
Client Company D's Voice:
"Before commissioning Empathy Design, we had an 'easy-to-see site' made. But revenue didn't increase.
This time, design using EMPATHY Map improved purchase rate by 64%. Because they responded one by one to customers' 'hesitation,' 'doubt,' and 'distrust.'
Empathy-based UX design isn't merely design. It's technology for understanding customers' hearts."
Chapter 6: The Detective's Diagnosis—Emotion as a Map
That night, I reflected on the essence of EMPATHY Map.
Empathy Design was collecting data. However, data hides emotions. Even when customers answer "satisfied," "hesitation" or "doubt" hide beneath.
Visualizing emotional flow with EMPATHY Map revealed reasons for behavior. What customers see, hear, feel, and say. These four perspectives drew the psychological curve leading to purchasing behavior.
"It begins not with understanding, but with feeling. EMPATHY Map transforms emotion into designable elements."
The next case will also depict the moment when empathy generates behavior.
"Don't ask questions, observe. See, Hear, Feel, Say. Describe customers from 4 perspectives and respond to emotional flow. Empathy is designable."—From the detective's notes
Related Files
🎖️ Top 3 Weekly Ranking of Classified Case Files
What is ROI
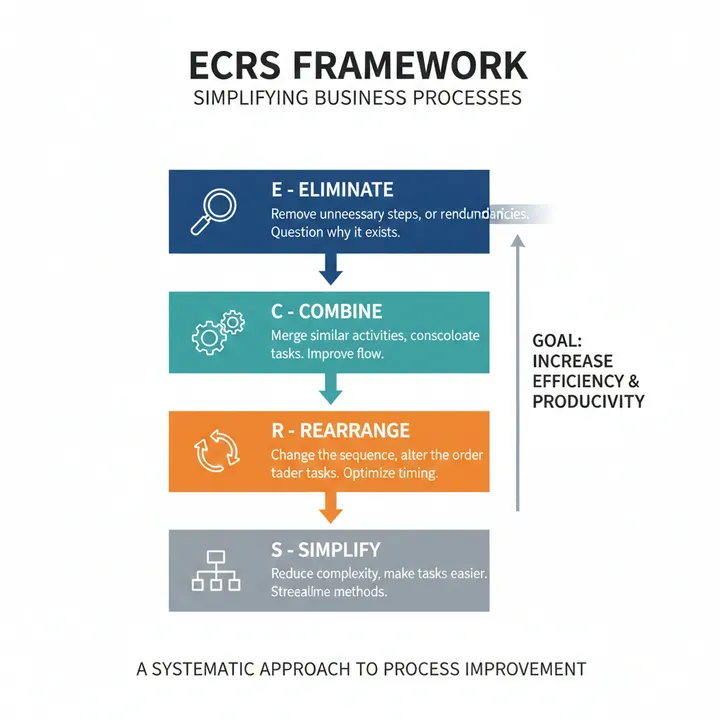
What is the ECRS Principle

What is the RICE Framework