ROI Case File No.342 | 'AllureSign's 8-Hour Gap'
📅 2025-12-03 23:00
🕒 Reading time: 9 min
🏷️ PPM

- Chapter 1: The Uncertainty of Corrections—1 Minute or 8 Hours
- Chapter 2: The AI Implementation Expectation—Can Everything Be Auto-Corrected?
- Chapter 3: Discovery Through Classification—The 4 Quadrants of Correction Work
- Chapter 4: Execution Through Automation—Results After 6 Months
- Chapter 5: Detective's Diagnosis—Classification Creates Efficiency
- Related Files
Chapter 1: The Uncertainty of Corrections—1 Minute or 8 Hours
The day after resolving Globex Corporation's customer management case, a consultation arrived regarding signage production workflow efficiency. Volume 28 "The Pursuit of Reproducibility," Story 342, is a tale of mastering work time variations.
"Detective, our correction work is unpredictable. Some finish in 1 minute, others take 8 hours. And thirteen staff members battle this uncertainty daily."
AllureSign's Operations Improvement Director, Mika Tanaka from Osaka, visited 221B Baker Street with an exhausted expression. In her hands were distribution graphs of correction work times and, in stark contrast, an operations analysis report marked "3,000 cases monthly, manual work."
"We specialize in corporate signage production. Store signs, outdoor advertising, signage. Approximately 36,000 productions annually. However, all require correction work."
AllureSign's Operations Structure: - Established: 2008 (Signage production and installation) - Annual production: Approximately 36,000 cases - Correction work staff: 13 (dedicated) - Monthly corrections: Approximately 3,000 cases - Correction time: 1 minute to 8 hours (average 2.3 hours) - Problem: Large time variations making resource allocation inefficient
Tanaka's voice carried deep anxiety.
"We receive Illustrator data from customers. However, that data cannot be printed as-is. Corrections are necessary. Setting fixture positions, color adjustments, size optimization. Parts customers cannot correct, we manually correct."
Typical Correction Work Examples:
Pattern 1: Simple Corrections (1-10 minutes): - Content: Color fine-tuning, text typo corrections - Frequency: Monthly approximately 1,200 cases (40%) - Work time: Average 5 minutes - Staff: Anyone can handle
Pattern 2: Medium Corrections (30 minutes-2 hours): - Content: Fixture position setting, size adjustment, layout correction - Frequency: Monthly approximately 1,500 cases (50%) - Work time: Average 1 hour - Staff: Experienced personnel handle
Pattern 3: Complex Corrections (4-8 hours): - Content: Data reconstruction, complex fixture placement, major design changes - Frequency: Monthly approximately 300 cases (10%) - Work time: Average 6 hours - Staff: Only veterans can handle
Tanaka sighed deeply.
"The problem is we don't know which pattern before starting. What we think is 'simple' sometimes takes 8 hours. Conversely, what seems 'difficult' sometimes finishes in 10 minutes.
One person per case. When it takes 8 hours, that staff member is tied up all day. Result: other cases don't progress, delivery delays occur. Our president ordered 'improve this,' but we don't know where to start."
Chapter 2: The AI Implementation Expectation—Can Everything Be Auto-Corrected?
"Ms. Tanaka, do you want to automate all correction work with AI technology?"
Tanaka immediately responded to my question.
"Yes, ideally full automation. However, realistically it's difficult. Complex corrections still need human judgment. But if we could just automate simple corrections, it would make a big difference."
Current Understanding (Partial Automation Type): - Expectation: Automate simple corrections with AI - Problem: Priorities for which corrections to automate are unclear
I explained the importance of classifying projects and optimally allocating resources.
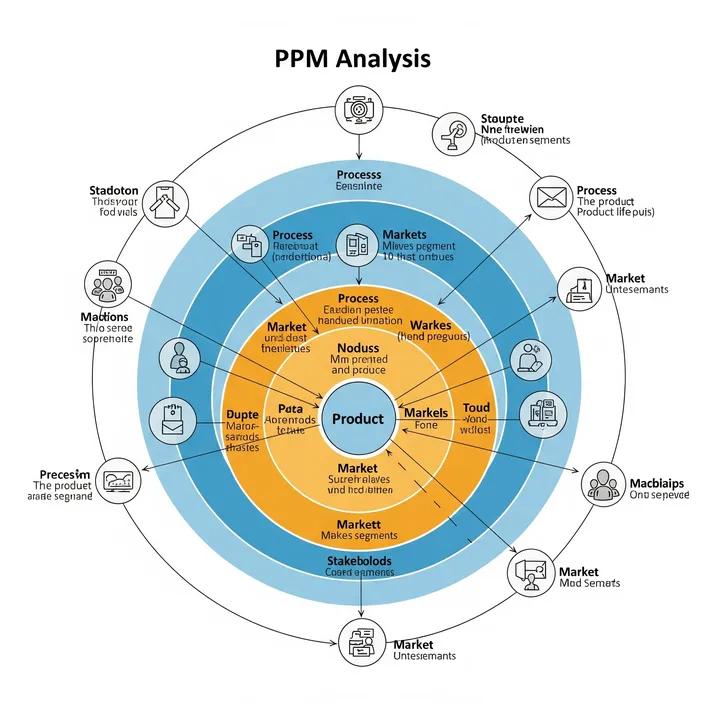
"The problem is 'treating all corrections the same.' PPM—Product Portfolio Management. A method to classify products and assign optimal strategies. This time, we'll classify correction work as projects and assign optimal response methods to each."
⬜️ ChatGPT | Catalyst of Conception
"Don't treat everything the same. Classify. Prioritize with PPM and optimize resource allocation"
🟧 Claude | Alchemist of Narrative
"1-minute work and 8-hour work don't always have the same 'value.' Classification creates efficiency"
🟦 Gemini | Compass of Reason
"PPM is strategic technology. Classify projects into 4 quadrants and determine optimal resource allocation"
The three members began analysis. Gemini deployed "PPM Framework" on the whiteboard.
PPM's 4 Quadrants (BCG Matrix Type): 1. Stars: High Value × High Frequency 2. Cash Cows: High Value × Low Frequency 3. Question Marks: Low Value × High Frequency 4. Dogs: Low Value × Low Frequency
"Ms. Tanaka, let's first classify 3,000 correction cases into these 4 quadrants."
Chapter 3: Discovery Through Classification—The 4 Quadrants of Correction Work
Phase 1: Correction Work Classification (3 weeks)
Analyzed past 6 months' correction work data (18,000 cases).
Analysis Axes: - Value Added: Contribution to sales/profit through corrections - Frequency: Monthly occurrence count
Quadrant 1: Stars — High Value × High Frequency
Content: - Fixture position setting (directly linked to safety) - Size optimization (material cost reduction) - Accurate color reproduction (customer satisfaction improvement)
Characteristics: - Monthly 1,800 cases (60%) - Average work time: 1.2 hours - Value added: High (safety, cost reduction, satisfaction)
Current Response: - All manual work - Experienced staff handle
Strategy: "Invest and grow" - Prioritize AI auto-correction system development - Create further value through accuracy improvement
Quadrant 2: Cash Cows — High Value × Low Frequency
Content: - Complex design reconstruction - Special fixture placement (large signs) - Regulatory compliance (road signs, etc.)
Characteristics: - Monthly 300 cases (10%) - Average work time: 6 hours - Value added: Very high (high-value projects, expertise)
Current Response: - Veterans handle - One case ties up one day
Strategy: "Maintain current state, efficiency improvement unnecessary" - Area requiring human expertise - Leverage veteran skills, not AI - However, efficiency through work procedure documentation
Quadrant 3: Question Marks — Low Value × High Frequency
Content: - Text typo corrections - Color fine-tuning (brand color unification) - Simple layout adjustments
Characteristics: - Monthly 1,200 cases (40%) - Average work time: 5 minutes - Value added: Low (typo correction necessary but no advanced skills needed)
Current Response: - Anyone can handle - However, 5 minutes per case, 1,200 cases = 100 hours/month
Strategy: "Automate or withdraw" - Complete automation with AI auto-correction (high investment effectiveness) - Reallocate human resources to Stars
Quadrant 4: Dogs — Low Value × Low Frequency
Content: - Repeated customer change requests (no additional charges) - Corrections from unclear instructions (customer communication failures)
Characteristics: - Monthly -300 cases (none applicable, managed to prevent) - Value added: Negative (waste of time and cost)
Strategy: "Withdraw or prevent" - Specify correction count limits in contracts - Prevent through improved initial hearings
Phase 2: Strategy Formulation (1 week)
Formulated strategy based on PPM analysis.
Priority 1: Question Mark Automation (100 hours monthly reduction) - Automate simple corrections (typos, color adjustments, layout) with AI - Monthly 1,200 cases × 5 minutes = 100 hours - Reallocate human resources to Stars
Priority 2: Stars Semi-Automation (540 hours monthly reduction) - AI proposes fixture positions, size optimization, color reproduction - Humans conduct final verification - Monthly 1,800 cases × 1.2 hours → 0.5 hours (reduction: 0.7 hours/case) - Reduction: 1,800 cases × 0.7 hours = 1,260 hours/month
Priority 3: Cash Cows Efficiency (60 hours monthly reduction) - Standardize work procedures - Document veteran know-how - Monthly 300 cases × 6 hours → 5.8 hours (reduction: 0.2 hours/case) - Reduction: 300 cases × 0.2 hours = 60 hours/month
Total Reduction Time: 1,420 hours monthly
Chapter 4: Execution Through Automation—Results After 6 Months
Phase 3: AI Auto-Correction System Implementation (4 months)
System Specifications: - Tool: Certain AI image analysis/correction tool (Illustrator integration type) - Functions: - Typo detection/correction (dictionary-based) - Color adjustment (brand color database reference) - Layout optimization (template-based) - Fixture position proposal (automatic calculation based on safety standards) - Size optimization (material cost reduction algorithm)
Implementation Cost: - Initial development: 12 million yen - Monthly operation: 300,000 yen
Phase 4: Operations Launch (Month 4-10)
Question Mark Automation Results:
Auto-correction targets: Monthly 1,200 cases - Auto-correction success rate: 94% (1,128 cases) - Human verification needed: 6% (72 cases) - Work time: 1,128 cases × 30 seconds (AI processing) = 564 minutes (9.4 hours) - Reduction: 100 hours - 9.4 hours = 90.6 hours/month
Stars Semi-Automation Results:
Semi-auto correction targets: Monthly 1,800 cases - AI proposes correction plans: 100% - Humans conduct final verification/fine-tuning: Average 0.5 hours - Work time: 1,800 cases × 0.5 hours = 900 hours/month - Before: 1,800 cases × 1.2 hours = 2,160 hours/month - Reduction: 1,260 hours/month
Cash Cows Efficiency Results:
Standardization targets: Monthly 300 cases - Standardized work procedures - Veteran know-how documented in videos/documents - Mid-level staff can now handle - Work time: Average 5.8 hours/case - Reduction: 300 cases × 0.2 hours = 60 hours/month
Results After 6 Months:
Work Time Reduction: - Before: Monthly 3,000 cases × 2.3 hours = 6,900 hours - After: Monthly 3,000 cases × 1.0 hours = 3,000 hours - Reduction: 3,900 hours/month (57% reduction)
Labor Cost Reduction: - Hourly wage conversion: 2,800 yen (staff average hourly wage) - Reduction: 3,900 hours × 2,800 yen = 10.92 million yen/month
Annual Reduction Effect: - 10.92 million yen/month × 12 months = 131.04 million yen/year
Investment Recovery: - Initial investment: 12 million yen + 300,000 yen × 6 months = 13.8 million yen - Reduction effect: 10.92 million yen/month × 6 months = 65.52 million yen - ROI: 375% (6 months) - Investment recovery period: 1.3 months
Delivery Delay Improvement: - Before: Monthly average 15 delivery delays - After: Monthly average 2 - Improvement: 87% reduction
Customer Satisfaction: - Before: NPS 52 - After: NPS 71 - Improvement: +19 points
Organizational Changes:
Staff A's Voice: "Previously, even simple corrections were all manual. Fixing one typo took 5 minutes. With 50 daily, that's 250 minutes (over 4 hours). Monotonous, exhausting work.
But since AI was introduced, simple corrections are automated. My job is just verifying AI-corrected content. 30 seconds per case. And I use the freed time for more advanced correction work."
Veteran Staff B's Voice: "Complex corrections are my specialty. Can't leave them to AI. But AI proposes fixture positions and size optimizations. I just verify and fine-tune. Work time cut in half.
And my know-how was documented. Mid-level staff can now learn my techniques."
Tanaka's Reflection:
"Until applying PPM, we made the mistake of 'treating all corrections the same.' 1-minute corrections and 8-hour corrections were both treated as 'correction work.'
But classification with PPM revealed priorities. Automate Question Marks (low value × high frequency), semi-automate Stars (high value × high frequency), leverage human expertise for Cash Cows (high value × low frequency).
Result: Monthly 3,900 hours (57%) reduction, annual 131.04 million yen labor cost reduction. Delivery delays reduced 87%, customer satisfaction improved 19 points.
Work time variations are no longer problems. Each has optimal response methods."
Chapter 5: Detective's Diagnosis—Classification Creates Efficiency
That evening, I contemplated the importance of project classification.
AllureSign made the mistake of "treating all corrections the same." 1-minute work and 8-hour work were handled with same resources.
Classifying correction work into 4 quadrants with PPM revealed optimal strategies. Question Marks automate, Stars semi-automate, Cash Cows human expertise. This classification produced monthly 3,900-hour reduction and annual 131.04 million yen effect.
"Don't treat everything the same. Classify. Prioritize with PPM and optimize resource allocation. 1 minute and 8 hours don't have equal value."
The next case will also depict the moment of classifying projects.
"Stars, Cash Cows, Question Marks, Dogs. Classify into 4 quadrants and assign optimal strategies. Don't treat everything the same. Classification creates efficiency"—From the Detective's Notes
Related Files
🎖️ Top 3 Weekly Ranking of Case Files

'QuantumGrocers' Lost Customer Data'

AeroSpray's Vanishing Sales Force'
'GlobalSoft's Drowning Inquiry Response'