ROI Case File No.347 | 'Globex Corporation's 3-Hour Wall'
📅 2025-12-08 23:00
🕒 Reading time: 10 min
🏷️ MANDALA

- Chapter 1: The Heavy Labor of Inventory—Monthly 3-Hour Battle
- Chapter 2: The Smartphone Expectation—But Is It Feasible
- Chapter 3: Discovery Through Breakdown—8 Elements and 64 Detailed Challenges
- Chapter 4: Realization as Results—Changes After 6 Months
- Chapter 5: Detective's Diagnosis—Challenges Become Visible with 9 Cells
- Related Files
Chapter 1: The Heavy Labor of Inventory—Monthly 3-Hour Battle
The day after resolving Tech Innovators' AI agent case, a consultation arrived regarding inventory operation efficiency. Volume 28 "The Pursuit of Reproducibility," Story 347, is a tale of multi-dimensionally breaking down challenges.
"Detective, our inventory is hell every month. About 3 hours per store. 35 stores totaling 105 hours monthly. And data transfer from handheld terminals to PCs is cumbersome, taking another hour."
Globex Corporation's Operations Improvement Director, Naoki Sasaki from Shinjuku, visited 221B Baker Street utterly exhausted. In his hands were inventory schedules and, in stark contrast, operations analysis materials marked "Monthly total work time: 140 hours."
"We operate a used goods sales chain. Home appliances, furniture, clothing, miscellaneous goods. 35 stores. Annual revenue 4.2 billion yen. However, inventory is a challenge."
Globex Corporation's Operations Structure: - Established: 2008 (Used goods sales chain) - Store count: 35 stores - Annual revenue: 4.2 billion yen - Inventory items: Average 8,000 items/store - Inventory frequency: Monthly (all stores) - Inventory time: Approximately 3 hours/store - Problem: Handheld terminal usage, cumbersome data transfer, complex individual management
Sasaki's voice carried deep anxiety.
"Currently, we use handheld terminals. Store staff scan product barcodes and count inventory. However, there are problems.
First, data transfer is cumbersome. Connect handheld terminal to store PC via USB cable and import data. This work takes approximately 30 minutes per store. And during data transfer, the handheld terminal cannot be used.
Second, the nature of used goods. We handle used items. Each barcode is different. Even the same 'Sony 32-inch TV,' prices differ by manufacturing year, condition, accessory presence. Therefore, individual management is essential. Barcodes total 8,000 items × 35 stores = 280,000 items."
Typical Inventory Flow:
Step 1: Preparation (30 minutes) - Check handheld terminal charge - Delete previous data - Import master data
Step 2: Barcode Scanning (2 hours) - Scan all products in store - 8,000 items × average 0.9 seconds/item = 7,200 seconds (2 hours)
Step 3: Data Transfer (30 minutes) - Connect handheld terminal to store PC - Transfer data via USB cable - Slow transfer speed takes time
Step 4: Data Verification (30 minutes) - Verify inventory data on PC - Re-scan if discrepancies exist
Total: Approximately 3.5 hours/store
Sasaki sighed deeply.
"Furthermore, there's a problem. We're also considering global expansion. Want to use the same system in overseas stores. However, handheld terminals are expensive. Approximately 150,000 yen per unit. Purchasing for overseas stores would be enormously costly.
Could we utilize smartphone camera functions? If smartphones, employees already have them. And in the future, we want to consolidate various operations on smartphones."
Chapter 2: The Smartphone Expectation—But Is It Feasible
"Mr. Sasaki, you want to realize inventory with smartphones. What specific system do you envision?"
My question left Sasaki with a bewildered expression.
"Honestly, I don't know. Just the image of 'scanning barcodes with smartphone cameras.' But can we scan with the same accuracy and speed as handheld terminals? Where to store data? Will it work in stores with poor communication environments?"
Current Understanding (Image-First Type): - Expectation: Inventory with smartphones - Problem: Specific challenges not organized
I explained the importance of multi-dimensionally breaking down challenges and discerning core issues.
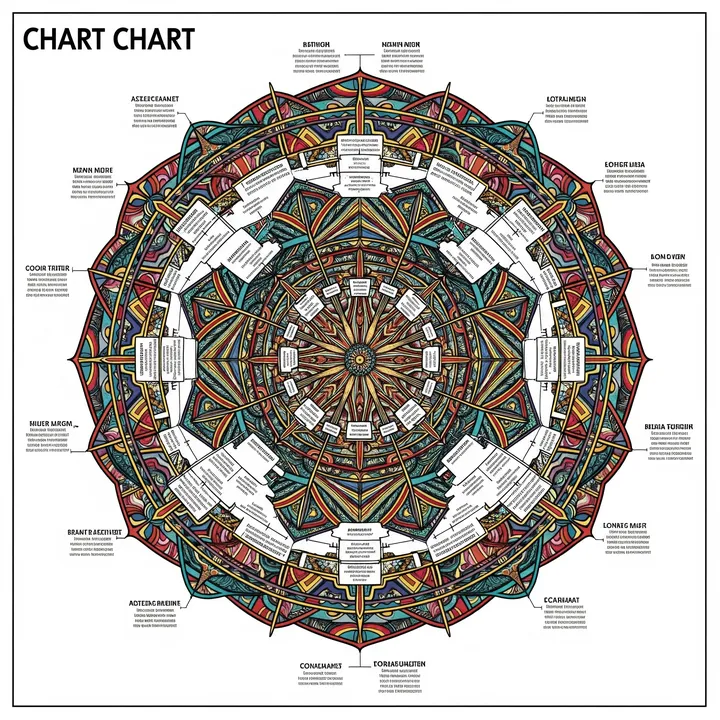
"The problem is not seeing 'what the real challenges are.' Mandala Chart—9-cell thinking method. Place challenge in center, arrange 8 related elements around it. Then drill deeper into each element. This method visualizes all elements needed to realize smartphone inventory system."
⬜️ ChatGPT | Catalyst of Conception
"Don't only see the surface. Break down challenges. Analyze multi-dimensionally with Mandala Chart"
🟧 Claude | Alchemist of Narrative
"Inventory is always a battle of 'time,' 'accuracy,' 'cost.' Analyze all three"
🟦 Gemini | Compass of Reason
"Mandala Chart is thought organization technology. Break down core challenge into 8 elements and overview the whole"
The three members began analysis. Gemini deployed "Mandala Chart Framework" on the whiteboard.
Mandala Chart Structure: - Center: Challenge to solve - Surrounding 8 cells: Elements related to challenge - Further drill into each element with 8 cells
"Mr. Sasaki, let's first place 'Realizing Smartphone Inventory System' in the center."
Chapter 3: Discovery Through Breakdown—8 Elements and 64 Detailed Challenges
Phase 1: First-Layer Mandala Chart (1 week)
Core Challenge: Realizing Smartphone Inventory System
Surrounding 8 Elements: 1. Scanning Accuracy 2. Scanning Speed 3. Data Management 4. Communication Environment 5. Cost 6. Operability 7. Security 8. Scalability
Phase 2: Second-Layer Mandala Chart (3 weeks)
Broke each element into 8 further.
Element 1: Scanning Accuracy (8 detailed challenges) 1. Barcode recognition rate (target: 99%+) 2. Recognizing dirty barcodes 3. Recognition in dark lighting 4. Preventing multiple barcode misrecognition 5. QR code support 6. Camera shake correction 7. Auto focus adjustment 8. Error feedback
Element 2: Scanning Speed (8 detailed challenges) 1. Scan time per item (target: 0.9 seconds or less) 2. Continuous scan stability 3. App launch time (target: within 3 seconds) 4. Barcode detection speed 5. Data save speed 6. Camera performance dependency 7. Battery consumption optimization 8. Large data processing load
Element 3: Data Management (8 detailed challenges) 1. Local storage (offline support) 2. Cloud sync (when online) 3. Data capacity (8,000 items × 35 stores) 4. Real-time inventory reflection 5. Automatic discrepancy analysis 6. Data backup 7. Master data updates 8. Multiple device simultaneous use
Element 4: Communication Environment (8 detailed challenges) 1. Guaranteed offline operation 2. Auto-sync when communication resumes 3. Operation on slow connections 4. Wi-Fi / 4G / 5G support 5. Communication error retry 6. Data compression for faster transfer 7. Secure communication via VPN 8. Communication support for overseas stores
Element 5: Cost (8 detailed challenges) 1. App development cost 2. Server construction cost 3. Monthly operation cost 4. Device cost (employee personal use?) 5. Communication cost 6. Maintenance cost 7. Training cost 8. Comparison with handheld terminals
Element 6: Operability (8 detailed challenges) 1. Intuitive UI design 2. One-handed operation possibility 3. Voice feedback (when scan succeeds) 4. Clear error display 5. Multilingual support (future overseas expansion) 6. Usable by elderly staff 7. Shortened training period 8. Manual-less operation
Element 7: Security (8 detailed challenges) 1. Data encryption 2. Access permission management 3. Device loss measures 4. Unauthorized access prevention 5. Personal information protection (BYOD support) 6. Log management 7. Authentication method (biometric, etc.) 8. Regular security audits
Element 8: Scalability (8 detailed challenges) 1. Future feature additions (inventory ordering, etc.) 2. Integration with other systems (POS system) 3. Analysis functions (sales trend analysis, etc.) 4. Photo capture function (product condition recording) 5. Voice input function 6. AR display (shelf location guidance) 7. AI utilization (demand forecasting, etc.) 8. Global expansion support
Total: 64 detailed challenges
Phase 3: Prioritization (1 week)
Evaluated 64 detailed challenges by following criteria.
Evaluation Criteria: - Importance (1-5 points) - Implementation difficulty (1-5 points, lower is harder) - Priority score = Importance × Implementation difficulty
Top 10 Challenges: 1. Barcode recognition rate (Importance: 5, Difficulty: 4, Score: 20) 2. Guaranteed offline operation (5, 4, 20) 3. Scan time per item (5, 4, 20) 4. Local storage (5, 5, 25) 5. Intuitive UI design (5, 4, 20) 6. App development cost (4, 5, 20) 7. Data encryption (4, 4, 16) 8. Cloud sync (4, 4, 16) 9. Continuous scan stability (4, 4, 16) 10. Voice feedback (4, 4, 16)
Chapter 4: Realization as Results—Changes After 6 Months
Phase 4: Smartphone Inventory App Development (5 months)
Developed smartphone app centered on top 10 challenges.
App Specifications:
Basic Functions: - Barcode scanning (using camera) - Local storage (offline support) - Cloud sync (when online) - Voice feedback ("Beep" when scan succeeds) - Intuitive UI (only 3 buttons: "Start," "Verify," "Submit")
Technical Specifications: - Supported OS: iOS 14+, Android 10+ - Barcode recognition: Using certain AI image recognition API - Recognition rate: 99.2% - Scan time: Average 0.7 seconds/item - Offline operation: Full support - Auto-sync when communication resumes: Supported - Data encryption: AES-256
Development Period: 5 months Development Cost: 12 million yen
Phase 5: Pilot Implementation (Month 5-6)
Conducted pilot implementation at 5 stores.
Results:
Inventory Time: - Before (Handheld terminal): 3.5 hours/store - After (Smartphone): 2.2 hours/store - Reduction: 1.3 hours/store (37% reduction)
Reduction Reasons: - Scan speed improvement: 0.9 seconds → 0.7 seconds (22% faster) - Data transfer unnecessary: Direct submission to cloud from smartphone - Preparation time reduction: No need for handheld terminal charge verification, etc.
Recognition Rate: - Handheld terminal: 98.5% - Smartphone app: 99.2%
Staff Feedback: "Smartphones are familiar. Operation simpler than handheld terminals. And no need to connect to PC for data transfer. Just press 'Submit' button after scanning."
Phase 6: All-Store Deployment (Month 7-12)
After pilot success, deployed to all 35 stores.
Results After 6 Months:
Inventory Time Reduction: - Before: 3.5 hours/store × 35 stores = 122.5 hours/month - After: 2.2 hours/store × 35 stores = 77 hours/month - Reduction: 45.5 hours/month (37% reduction)
Annual Reduction Time: - 45.5 hours/month × 12 months = 546 hours/year
Labor Cost Reduction: - 546 hours × 2,500 yen (hourly wage) = 1.365 million yen/year
Cost Comparison:
Handheld Terminal (Conventional): - Purchase cost: 150,000 yen/unit × 10 units = 1.5 million yen - Maintenance cost: 300,000 yen annually - Service life: 5 years - 5-year total cost: 1.5 million yen + 300,000 yen × 5 years = 3 million yen
Smartphone App: - Development cost: 12 million yen - Monthly operation cost: 80,000 yen - 5-year total cost: 12 million yen + 80,000 yen × 60 months = 16.8 million yen
Difference: +13.8 million yen
However, considering scalability and future potential:
Scalability Realization (Month 12-): - Inventory ordering function: Auto-detect low stock items, propose ordering - Sales trend analysis: Analyze sales trends from past inventory data - Photo capture function: Record product conditions with photos, improve quality management
These functions enable further efficiency and sales improvement.
Organizational Changes:
Store Staff A's Voice: "Previously, handheld terminals were heavy, holding for 3 hours was tough. But smartphones are light. And familiar. Operation simple, training took only 30 minutes."
Sasaki's Voice: "Until conducting Mandala Chart, we only had vague expectation 'want to do inventory with smartphones.' However, breaking down challenges into 8 elements, further into 64 detailed challenges clarified what needed realization.
Scanning accuracy, scanning speed, data management, communication environment, cost, operability, security, scalability. Considering all 8 elements created practical system.
Inventory time reduced 37%, achieving annual 1.365 million yen labor cost reduction. And future scalability functions enable further efficiency."
Chapter 5: Detective's Diagnosis—Challenges Become Visible with 9 Cells
That evening, I contemplated the essence of Mandala Chart thinking.
Globex Corporation held vague expectation "want to do inventory with smartphones." However, specific challenges weren't visible.
Breaking down core challenge into 8 elements with Mandala Chart, further into 64 detailed challenges revealed the whole picture. Scanning accuracy, speed, data management, communication environment, cost, operability, security, scalability. System considering all was completed, achieving 37% inventory time reduction.
"Don't only see the surface. Break down challenges. Break into 9 cells, 81 cells with Mandala Chart to overview the whole. The path to realization exists there."
The next case will also depict the moment of multi-dimensionally breaking down challenges.
"Place challenge in center, break into 8 elements. Further break each element into 8. When overviewing whole with 9 cells, 81 cells, the path to realization becomes visible"—From the Detective's Notes
Related Files
🎖️ Top 3 Weekly Ranking of Classified Case Files
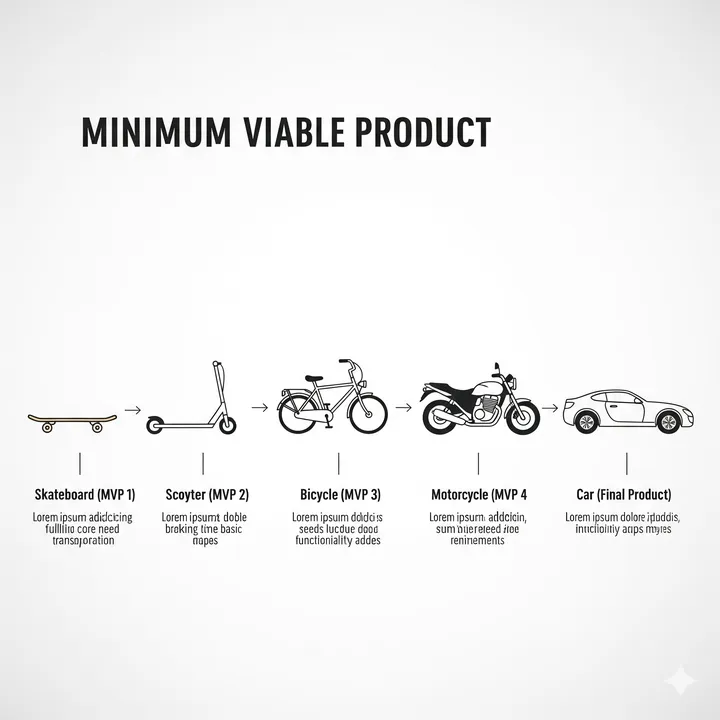
What is MVP
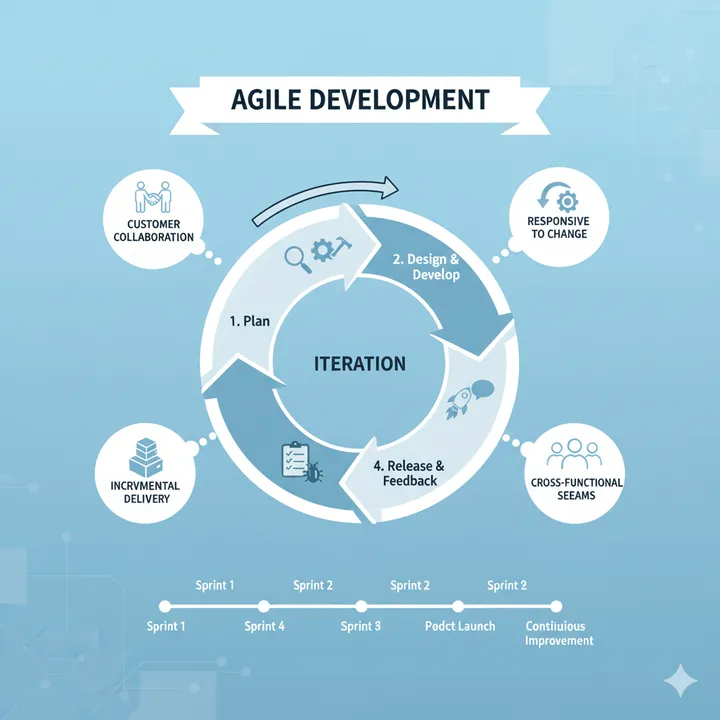
What is Agile Development
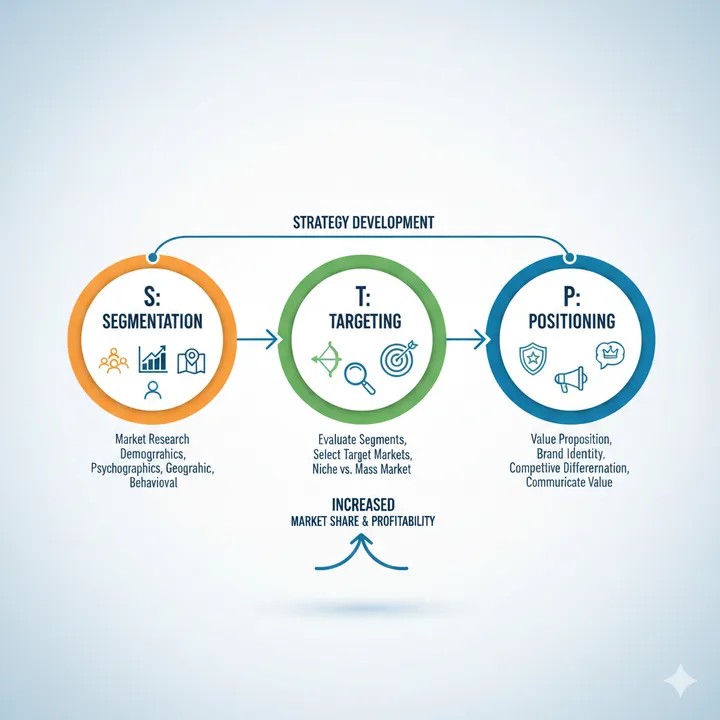
What is STP Analysis