ROI Case File No.366 | 'Globex Corporation's Three-System Fragmentation'
📅 2025-12-27 23:00
🕒 Reading time: 12 min
🏷️ MANDALA

- Chapter 1: Three-System Fragmentation — The Illusion of Unified Management
- Chapter 2: Unified Management Simplification — Multilayered Structure Invisible
- Chapter 3: Phase 1 — Structuring Multilayeredly Through MANDALA
- Chapter 4: Phase 2 — Project Execution and Effect Measurement
- Chapter 5: Detective's Diagnosis — Organizing Multilayered Structure Through MANDALA
- Related Files
Chapter 1: Three-System Fragmentation — The Illusion of Unified Management
The day after resolving PrintMaster's value chain case, a consultation arrived regarding core system integration. Volume 29, "The Pursuit of Reproducibility," Case 366 tells the story of organizing complexity through multilayered thinking.
"Detective, our systems are fragmented into three. Signage business management system, CS business management system, transit media management system. We built each separately for each business. However, for business expansion, we want to consolidate these into one. However, 20 project members' opinions aren't unified. We're confused about what to proceed with and how."
Makoto Takahashi, CIO of Globex Corporation, a Shinjuku native, visited 221B Baker Street with a confused expression. In his hands, he held design documents for three different systems, contrasting sharply with an integration plan document titled "Integrated Core System Project Roadmap 2026-2028."
"We operate advertising media business. 250 employees. Annual revenue of 8.5 billion yen. Outdoor advertising like signboards, indoor advertising like digital signage, advertising placement on media owned by transit operators. We've grown through three businesses. However, system fragmentation has reached its limit."
Globex Corporation's Current State: - Founded: 1998 (Advertising media business) - Employees: 250 - Annual Revenue: 8.5 billion yen - Businesses: Signage business, CS business (digital signage), transit media business - Issues: Three-system fragmentation, no data integration, project policy confusion
Deep anxiety resonated in Takahashi's voice.
"Let me explain the three systems' problems. First, the signage business management system. Built in 2010. Integrates project management, quotations, contracts, construction management, sales management. However, over 10 years have passed, making maintenance difficult.
Next, the CS business management system. Built in 2018. Digital signage distribution management, advertiser management, distribution schedule management. Built with latest technology, but no integration with signage business.
Finally, the transit media management system. Built in 2022. Frame management for station premises and vehicle interior advertising, reservation management, sales management. This also has no integration with other systems."
Problems From Three-System Fragmentation:
Problem 1: Customer Information Dispersion - Same customers registered separately in three systems - Example: Company A registered in signage business, different ID in CS business, yet another ID in transit media business - Cannot grasp customer's overall picture
Problem 2: Sales Data Aggregation Difficulty - Sales data independent in each system - To aggregate company-wide sales, spend 3 days at month start manually aggregating in Excel - Cannot make real-time management decisions
Problem 3: Sales Efficiency Decline - Sales representatives log in to three systems separately - Project information input required 3 times (per system) - 20 hours/month waste per salesperson
Takahashi sighed deeply.
"Currently, 20 people including employees and external consultants are working on the core system renewal project. However, policy isn't determined. Opinions like 'should integrate everything into one system,' 'should separate due to business-specific characteristics,' 'should integrate in phases.' 20 people assert 20 different opinions, making it unmanageable.
We plan to submit RFPs to multiple companies in January 2026. We want to start requirements definition from June 2026, but at this rate, we won't make it."
Chapter 2: Unified Management Simplification — Multilayered Structure Invisible
"Mr. Takahashi, do you believe integrating three systems into 'one' will solve all problems?"
Takahashi answered my question immediately.
"Yes, unified management is ideal. However, we cannot ignore business-specific characteristics. I don't know how to organize it."
Current Understanding (Simple Integration Model): - Expectation: Combining three into one solves everything - Problem: System's multilayered structure remains invisible
I explained the importance of organizing complexity through multilayered thinking.
"The problem is the simplification of 'making three into one.' MANDALA. A thinking framework with multilayered structure. We organize hierarchically from center outward. Core functions, common functions, business-specific functions. By structuring in these three layers, reproducible integration becomes reality."
⬜️ ChatGPT | Catalyst of Conception
"Don't simply integrate. Structure multilayeredly through MANDALA and separate core from periphery"
🟧 Claude | Alchemist of Narrative
"Systems are always the 'skeleton of the enterprise.' When structure is clear, evolution becomes easy"
🟦 Gemini | Compass of Reason
"Think through MANDALA. Core at center, common functions around it, individual functions at outermost layer. Structure becomes visible"
The three members began analysis. Gemini developed the "MANDALA Framework" on the whiteboard.
MANDALA's Three-Layer Structure: 1. Center (Core): Core functions common to all businesses 2. Middle Layer (Common): Common functions across businesses 3. Outer Layer (Specific): Business-specific individual functions
"Mr. Takahashi, let's first organize Globex Corporation's systems in MANDALA structure."
Chapter 3: Phase 1 — Structuring Multilayeredly Through MANDALA
Step 1: Current System Function Inventory (3 weeks)
Divide 20 Project Members Into 3 Teams: - Team 1 (7 people): Signage business management system function inventory - Team 2 (7 people): CS business management system function inventory - Team 3 (6 people): Transit media management system function inventory
Function Inventory Results (Total 312 Functions):
Signage Business Management System (118 functions): - Customer management: 15 functions - Project management: 22 functions - Quotation creation: 18 functions - Contract management: 12 functions - Construction management: 28 functions (signage installation and maintenance) - Sales management: 15 functions - Billing management: 8 functions
CS Business Management System (102 functions): - Customer management: 12 functions - Advertiser management: 18 functions - Distribution schedule management: 25 functions - Digital signage terminal management: 20 functions - Content management: 15 functions - Sales management: 8 functions - Billing management: 4 functions
Transit Media Management System (92 functions): - Customer management: 10 functions - Media frame management: 28 functions (station premises, vehicle interior) - Reservation management: 22 functions - Display schedule management: 15 functions - Sales management: 12 functions - Billing management: 5 functions
Step 2: Classification in MANDALA Structure (2 weeks)
Classify All 312 Functions Into MANDALA 3 Layers:
Center Layer (Core): Core Functions Common to All Businesses (58 functions) - Customer master management: 1 function (integrated customer DB) - Sales management: 1 function (company-wide integrated sales DB) - Billing management: 1 function (integrated billing system) - Accounting integration: 1 function (API integration with accounting system) - User authentication and authorization management: 2 functions - Dashboard: 1 function (company-wide management indicator visualization) - Data analysis platform: 1 function (BI integration)
Middle Layer (Common): Common Functions Across Businesses (124 functions) - Project management: Common framework (30 functions) - Project registration, progress management, personnel assignment, history management - Quotation creation: Common templates (25 functions) - Quotation generation, unit price master, approval workflow - Contract management: Common processes (18 functions) - Contract creation, electronic contract integration, renewal management - Schedule management: Common calendar (15 functions) - Reservation management, resource management, conflict checking - Report functions: Common forms (20 functions) - Sales reports, utilization reports, customer analysis - Workflow: Common approval processes (16 functions)
Outer Layer (Specific): Business-Specific Individual Functions (130 functions) - Signage business-specific (52 functions) - Construction management (28 functions): Installation location management, construction schedule, safety management - Signage design management (12 functions): Design data management, printing integration - Maintenance management (12 functions): Regular inspections, repair history
- CS business-specific (48 functions)
- Digital signage distribution management (25 functions): Distribution schedule, real-time distribution
- Terminal management (20 functions): Terminal monitoring, incident response, log management
-
Content management (3 functions): Video and image upload
-
Transit media business-specific (30 functions)
- Media frame management (15 functions): Station-specific frame management, vehicle-specific frame management
- Transit operator integration (10 functions): Data integration with JR and private railways
- Display certificate issuance (5 functions): Automatic generation of advertising display certificates
MANDALA Structure Visualization:
┌─────────────────────────────────┐
│   Outer Layer (Specific) 130 functions    │
│   ┌───────────────────────┐     │
│   │ Middle Layer (Common) 124 functions  │     │
│   │  ┌─────────────────┐  │     │
│   │  │ Center Layer (Core)   │  │     │
│   │  │  58 functions        │  │     │
│   │  │                │  │     │
│   │  │ ・Customer Master   │  │     │
│   │  │ ・Sales Management     │  │     │
│   │  │ ・Billing Management     │  │     │
│   │  └─────────────────┘  │     │
│   │                           │     │
│   │ ・Project Management Framework  │     │
│   │ ・Quotation Creation Common Functions        │     │
│   │ ・Contract Management Common Functions        │     │
│   └───────────────────────┘     │
│                                     │
│ ・Signage Construction Management (52 functions)              │
│ ・CS Distribution Management (48 functions)                │
│ ・Transit Media Frame Management (30 functions)            │
└─────────────────────────────────┘
Step 3: Integration Policy Formulation (2 weeks)
Integration Strategy Based on MANDALA Structure:
Strategy 1: Center Layer (Core) Complete Integration - Use same system for all businesses - Customer master, sales management, billing management absolutely integrate - Development method: Scratch development or ERP package
Strategy 2: Middle Layer (Common) Build as Common Platform - Customizable per business, but platform is common - Project management, quotation creation, contract management are common framework - Development method: Microservices architecture
Strategy 3: Outer Layer (Specific) Independent Development Per Business - Develop flexibly according to each business's characteristics - API integration with center layer and middle layer - Development method: Agile development (per business)
Step 4: Phased Implementation Plan (2 weeks)
Phase 1 (June 2026 - March 2027): Center Layer Construction - Duration: 10 months - Target: Customer master, sales management, billing management, accounting integration, authentication - Development cost: 250 million yen - Effect: Company-wide customer unified management, real-time sales aggregation
Phase 2 (April 2027 - December 2027): Middle Layer Construction - Duration: 9 months - Target: Project management, quotation creation, contract management, schedule management - Development cost: 180 million yen - Effect: Sales efficiency improvement, business standardization
Phase 3 (January 2028 - December 2028): Outer Layer Migration - Duration: 12 months - Target: Signage construction management, CS distribution management, transit media frame management - Development cost: 120 million yen (distributed per business) - Effect: Each business's operational efficiency
Total Development Cost: 550 million yen Total Duration: 31 months (2 years 7 months)
Chapter 4: Phase 2 — Project Execution and Effect Measurement
January 2026: RFP Submission
RFP Based on MANDALA Structure: - Center layer: Complete integration, high reliability - Middle layer: Common platform, extensibility - Outer layer: Business-specific, flexibility
Received Proposals From 5 Companies Selection Result: Company B (Major SIer, rich ERP implementation experience)
June 2026 - March 2027: Phase 1 Execution (Center Layer)
Month 1-3: Requirements Definition - Customer master integration rule formulation - Sales management aggregation logic design - Billing management integration flow design
Month 4-7: Development - Customer master DB construction (integrated customer ID numbering) - Sales management system development - Billing management system development - API integration with accounting system
Month 8-9: Data Migration - Integrate customer data from 3 systems - Merge duplicate customers (consolidated from 8,500 companies to 6,200 companies)
Month 10: Production Launch
April 2027: Phase 1 Effect Measurement
KPI 1: Customer Information Unification - Before: Dispersed in 3 systems, 8,500 customers (including duplicates) - After: Integrated DB, 6,200 customers (merged) - Effect: Grasp customer overall picture, discover cross-sell opportunities
KPI 2: Real-Time Sales Data Aggregation - Before: Spend 3 days at month start manually aggregating in Excel - After: Real-time dashboard display - Time saved: 3 days × 3 people × 8 hours = 72 hours/month - Annual reduction: 72 hours × 12 months × 4,500 yen = 3.89 million yen/year
KPI 3: Management Decision Speed - Before: Report previous month's results at monthly reporting meeting (every 10th) - After: Grasp current day's results in real-time - Effect: Faster decision-making, reduced opportunity loss
April 2027 - December 2027: Phase 2 Execution (Middle Layer)
Month 1-3: Requirements Definition - Project management common framework design - Quotation creation common template design
Month 4-8: Development - Project management system development (microservices) - Quotation creation system development - Contract management system development
Month 9: Production Launch
January 2028: Phase 2 Effect Measurement
KPI 1: Sales Input Work Hour Reduction - Before: Separate input into 3 systems, 20 hours/month per person - After: One-time input into 1 system, 5 hours/month per person - Time saved: 15 hours/month/person × 80 people (sales) = 1,200 hours/month - Annual reduction: 1,200 hours × 12 months × 4,000 yen = 57.6 million yen/year
KPI 2: Quotation Creation Time Shortening - Before: 2 hours per case (manual Excel creation) - After: 30 minutes per case (system automatic generation) - Reduction rate: 75% - Annual quotations: 2,400 cases - Time saved: 1.5 hours × 2,400 cases = 3,600 hours/year - Annual reduction: 3,600 hours × 4,000 yen = 14.4 million yen/year
January 2028 - December 2028: Phase 3 Execution (Outer Layer)
Parallel Development Per Business: - Signage business: Construction management system renewal (6 months) - CS business: Distribution management system enhancement (4 months) - Transit media business: Media frame management system modification (5 months)
January 2029: Phase 3 Effect Measurement (All Phases Complete)
Overall Effect (Annual):
Cost Reduction: - Sales aggregation efficiency: 3.89 million yen/year - Sales input work hour reduction: 57.6 million yen/year - Quotation creation efficiency: 14.4 million yen/year - Total: 75.89 million yen/year
Sales Increase: - Cross-sell opportunity discovery: Average +8% sales increase from grasping customer overall picture - 8.5 billion yen × 8% = 680 million yen/year - With 20% profit margin, 136 million yen/year profit increase
Total Annual Effect: - 75.89 million + 136 million = 211.89 million yen/year
Investment: - Total development cost: 550 million yen - Annual operation cost: 35 million yen
ROI (3rd Year Point): - Cumulative effect: 211.89 million yen × 3 years = 635.67 million yen - Cumulative investment: 550 million + 35 million × 3 years = 655 million yen - ROI: (635.67 million - 655 million) / 655 million = -3% (19.33 million yen remaining to recovery in 3rd year) - Payback period: Approximately 3.1 years
4th Year Onward: - Annual net effect: 211.89 million - 35 million = 176.89 million yen/year
Chapter 5: Detective's Diagnosis — Organizing Multilayered Structure Through MANDALA
That night, I contemplated the essence of MANDALA thinking.
Globex Corporation held the simplification idea of "integrating three systems into one." However, corporate systems have multilayered structure.
By organizing through MANDALA structure, true integration strategy became clear. Center layer (Core) complete integration, middle layer (Common) common platform, outer layer (Specific) business-specific. By structuring in these three layers, "parts to integrate" and "parts to separate" became visible.
All 312 functions were classified into center layer 58 functions, middle layer 124 functions, outer layer 130 functions. And by integrating in phases, completion took 2 years 7 months.
Annual effect: 211.89 million yen, payback period: 3.1 years. From 4th year onward: 176.89 million yen annual net effect.
"Don't simply integrate. Structure multilayeredly through MANDALA. Core at center, common functions around it, individual functions at outermost layer. When structure is clear, integration path becomes visible. Reproducible integration emerges from multilayered thinking."
The next case will also depict the moment of organizing complexity through multilayered structure.
"MANDALA. Structure multilayeredly. Center and periphery, common and individual. When structure becomes visible, integration path becomes clear"—From the Detective's Notes
Related Files
🎖️ Top 3 Weekly Ranking of Classified Case Files
What is ROI
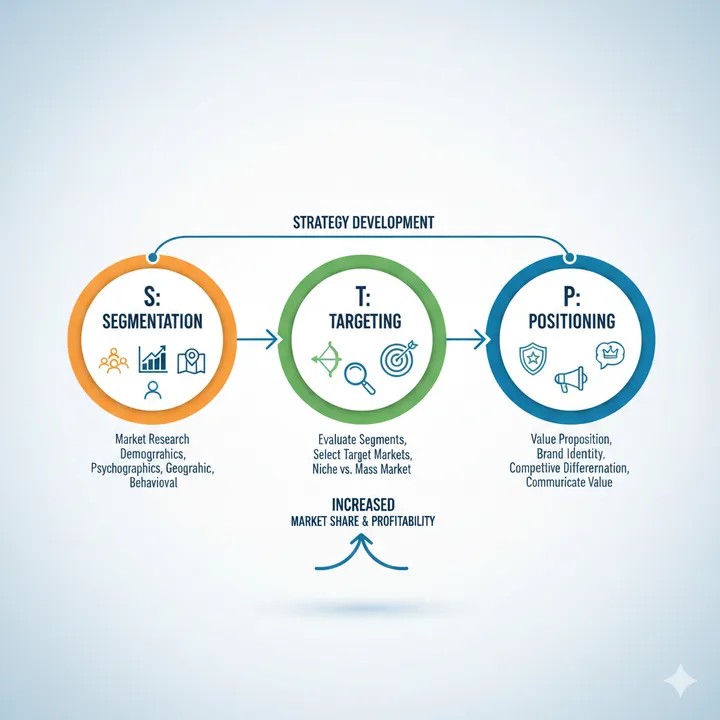
What is STP Analysis

What is the RICE Framework