ROI Case File No.375 | 'Globex Corporation's Illusion of Retail-to-EC Transition'
📅 2026-01-05 23:00
🕒 Reading time: 10 min
🏷️ OODA

- Chapter 1: Established Strength in Retail Sales—But EC Remains Untapped
- Chapter 2: The Trap of Plan-First Thinking—Markets Change Constantly
- Chapter 3: Phase 1—Observe to Grasp Consumer Truth
- Chapter 4: Phase 2—Orient to Define Strategy
- Chapter 5: Phase 3—Rapidly Iterate Decide & Act
- Chapter 6: Detective's Diagnosis—Market Adaptation Through Rapid PDCA
- Related Files
Chapter 1: Established Strength in Retail Sales—But EC Remains Untapped
The day after resolving Globex Inc.'s LOGIC case, a consultation arrived regarding EC site enhancement. Volume 30, "The Pursuit of Reproducibility," Case 375 tells the story of market adaptation through rapid PDCA.
"Detective, we have strength: retail sales. 85 stores nationwide. Annual revenue of 18 billion yen. But our EC site is weak. Annual revenue only 800 million yen. EC ratio 4.4%. Industry average is 22%. We want to close this gap. But we don't know what to do."
Kenta Sato, Marketing Director of Globex Corporation from Ginza, visited 221B Baker Street with an expression mixing anxiety and anticipation. In his hands were a performance report showing store-by-store sales rankings, and in stark contrast, a proposal from an existing vendor titled "EC Site Renewal Proposal 2026."
"We are an interior/furniture retailer. 450 employees. Annual revenue of 18.8 billion yen (retail 18B, EC 800M). We've focused on retail sales. But consumer online purchasing is increasing. EC enhancement is urgent."
Globex Corporation's Current State: - Founded: 1995 (interior/furniture retail) - Employees: 450 - Annual revenue: 18.8B yen (retail 18B, EC 800M) - Stores: 85 nationwide - EC ratio: 4.4% (industry average 22%) - Issues: Unclear EC strategy, unknown proposal validity, insufficient consumer needs understanding
Deep crisis permeated Sato's voice.
"We've received an EC site renewal proposal from our existing vendor, Company A. 'Renewal from OMO (Online Merges with Offline) perspective,' 'Scheduled release June 2026,' 'Investment 55 million yen.' But we can't judge if this proposal is valid. And we don't know what proposal-based content to create for consumer needs."
Existing Vendor Company A's Proposal:
Proposal 1: OMO-Type EC Site Construction - Integration of store and EC inventory - Product confirmation in store → Purchase on EC possible - Purchase on EC → Pickup in store possible
Proposal 2: Personalization Features - Recommendations from browsing/purchase history - AI chatbot for product suggestions
Proposal 3: Content Enhancement - Interior coordination examples (10/month) - Video content (product introductions, usage)
Investment: 55 million yen - System development: 38M yen - Content production: 12M yen - Operations/maintenance (annual): 5M yen
Sato sighed deeply.
"We discussed this proposal at the executive meeting. But opinions are divided. 'OMO is necessary,' 'No, content enhancement first,' 'What do consumers want anyway?' No conclusion. And only 5 months until June 2026 release. No time."
Chapter 2: The Trap of Plan-First Thinking—Markets Change Constantly
"Sato-san, do you believe that executing after perfect planning ensures success?"
My question left Sato looking confused.
"Isn't that the case? I thought we should establish a solid strategy and implement all features before launch."
Current Understanding (Plan-First Approach): - Expectation: Immediate success with perfect plan - Problem: Slow adaptation to market changes
I explained the importance of market adaptation through rapid PDCA.
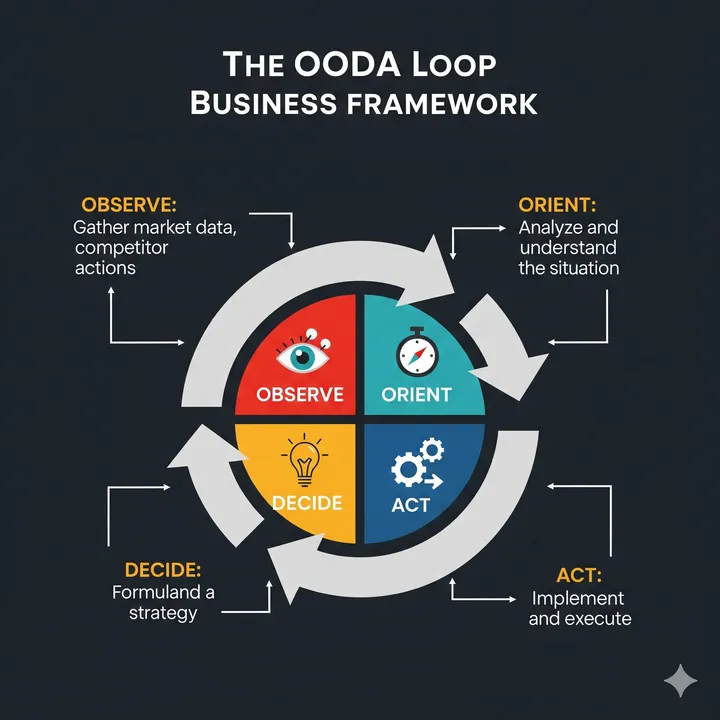
"The problem is thinking 'execute after perfect planning.' OODA—Observe, Orient, Decide, Act. By rapidly rotating this loop, we adapt to changing markets. Prioritizing Observe over Plan and repeating hypothesis validation reveals reproducible success patterns."
⬜️ ChatGPT | Catalyst of Concepts
"Don't make perfect plans. Rapidly rotate Observe-Act with the OODA Loop"
🟧 Claude | Story Alchemist
"Markets are always 'living creatures.' They don't follow plans. Observe and adapt"
🟦 Gemini | Compass of Reason
"Not PDCA but OODA. Prioritize observation over planning, adaptation over execution"
The three members began their analysis. Gemini displayed "OODA Loop vs. PDCA Cycle" on the whiteboard.
PDCA Cycle:
Plan → Do → Check → Act
Characteristics: Plan-focused, long cycle time (monthly)
OODA Loop:
Observe → Orient → Decide → Act → (Return to Observe)
Characteristics: Observation-focused, short loop time (weekly, daily)
"Sato-san, let's start by observing consumers."
Chapter 3: Phase 1—Observe to Grasp Consumer Truth
Step 1: Existing EC Site Data Analysis (1 week)
Access Analysis (GA4): - Monthly visitors: 18,000 - Bounce rate: 68% (industry average 55%) - Average session duration: 1 minute 45 seconds (industry average 3:30) - Conversion rate: 0.8% (industry average 2.5%)
Critical Discovery: - 68% of visitors leave without viewing product pages - Short session duration → Content not attractive - Low conversion rate → Weak purchase motivation
Purchase Data Analysis: - Monthly orders: 320 - Average order value: 25,000 yen - Repeat rate: 12% (industry average 35%)
Critical Discovery: - Extremely low repeat rate → Low customer loyalty - New customer acquisition cost: 8,500 yen/person (ad spend ÷ new customers) - LTV (Customer Lifetime Value): 28,000 yen (average order value × average purchases 1.12 times) - LTV < Acquisition cost → Loss structure
Step 2: Competitor EC Site Analysis (1 week)
Competitor A (Industry leader, EC ratio 45%): - Content: Daily updates of interior coordination examples - Features: Search by "room atmosphere" and "use case" - User reviews: Average 1,200/product
Competitor B (EC ratio 32%): - Content: 3D simulator (virtual furniture placement experience) - Features: Visualize "how it looks in my room" - SNS integration: Display Instagram posts on product pages
Critical Discovery: - Competitors propose "lifestyles," not just "sell products" - Utilize User-Generated Content (UGC) - Features to resolve pre-purchase anxiety (3D simulator, reviews)
Step 3: Consumer Interviews (2 weeks)
Subjects: - Existing customers 20 (10 store purchasers, 10 EC purchasers) - Non-purchasers 20 (people who left after visiting EC site)
Store Purchaser Voices: - "Want to see and touch the actual product" (18) - "Can't tell color and texture on EC" (15) - "Delivery and assembly troublesome" (12)
EC Purchaser Voices: - "No time to visit stores" (9) - "Bought on EC but different from image" (7) - "Want more coordination examples" (8)
Non-Purchaser Voices: - "Product pages are sterile and unattractive" (16) - "Don't know if it fits my room" (14) - "Few reviews make me anxious" (13)
Critical Discovery: - Consumer's biggest anxiety: "Don't know if it fits my room" - Desired content: "Actual usage examples, coordination cases" - EC challenge: "Product information alone doesn't create purchase motivation"
Chapter 4: Phase 2—Orient to Define Strategy
Step 4: Strategy Development from Observations (1 week)
Summary of Findings: 1. Existing EC site has extremely low 68% bounce rate and 0.8% conversion rate 2. Competitors succeed with "lifestyle proposal EC" 3. Consumer's biggest anxiety is "don't know if it fits my room"
Strategic Orientation:
Strategy 1: Proposal-Based Content Focus (Priority: Highest) - Transform from product catalog → lifestyle proposals - Present specific examples like "6-mat one-room coordination cases"
Strategy 2: Anxiety Resolution Features (Priority: High) - AR simulator: Virtual furniture placement experience via smartphone - Enhanced user reviews: Display actual purchaser photos
Strategy 3: OMO Integration (Priority: Medium) - Store-EC inventory integration necessary but postponed - First differentiate with content and features
Revision of Existing Vendor A's Proposal: - OMO integration (38M yen) → Postpone to Phase 2 - Content production (12M yen) → Enhance to 20M yen - AR simulator (new) → Add for 15M yen
Revised Investment: 35 million yen - Content production: 20M yen - AR simulator development: 15M yen
Chapter 5: Phase 3—Rapidly Iterate Decide & Act
Month 1: Decide - Minimal MVP Design
MVP (Minimum Viable Product): - Content: 10 coordination example patterns (6-mat, 8-mat, 10-mat, etc.) - AR simulator: Support only 20 core products - User reviews: Request actual photos from 20 existing customers
Target KPIs: - Bounce rate: 68% → 55% - Conversion rate: 0.8% → 1.5% - Monthly sales: 6.7M yen → 10M yen
Months 2-3: Act - MVP Implementation
Content Production: - Employ 3 professional interior coordinators - Photograph and article-ify 10 coordination examples - Add "Product list used" and "Purchase links" to each example
AR Simulator Development: - iOS/Android app development - Create 3D models of 20 core products - Photograph room with camera → Place furniture → Simulate
User Review Collection: - Run "Actual photo posting campaign" for 20 existing customers - Give 500 yen coupon to posters - Photos collected: 32
Month 4: Observe - Effect Measurement and Learning
KPI Measurement:
KPI 1: Bounce Rate - Before: 68% - After: 58% (target 55%, not achieved) - Improvement: +10 points
KPI 2: Conversion Rate - Before: 0.8% - After: 1.4% (target 1.5%, nearly achieved) - Improvement: +0.6 points
KPI 3: Monthly Sales - Before: 6.7M yen - After: 9.35M yen (target 10M, not achieved) - Improvement: +40%
Heatmap Analysis: - Coordination example page session duration: Average 4:20 - AR simulator usage rate: 12% of visitors - AR simulator user conversion rate: 8.5% (6× overall)
Critical Discovery: - AR simulator users have extremely high purchase intent - But usage rate 12% is low → Weak navigation - Coordination examples effective but insufficient quantity (10 is too few)
Month 5: Orient & Decide - Strategy Revision
Revised Strategy 1: Strengthen AR Simulator Navigation - Add "Try placing in room with AR" button to all product pages - Place large "Try AR simulator" banner on homepage
Revised Strategy 2: Expand Content Volume - Add 10 coordination examples monthly (total 20) - Display user-posted photos on product pages
Month 6: Act - Revised Implementation and Final Measurement
KPIs After Revised Implementation:
KPI 1: Bounce Rate - 58% → 52% (achieved target 55%)
KPI 2: Conversion Rate - 1.4% → 2.1% (far exceeded target 1.5%)
KPI 3: Monthly Sales - 9.35M → 13.8M yen (far exceeded target 10M)
KPI 4: AR Simulator Usage Rate - 12% → 28% (navigation strengthening effect)
KPI 5: AR Simulator User Conversion Rate - 8.5% → 9.2% (further improved)
Annual Effects (Month 6 onward, annualized):
Sales Increase: - Before: Annual EC sales 800M yen - After: Annual EC sales 1.32B yen (11M yen/month × 12 months) - Increase: 520M yen/year
Profit Increase (35% gross margin): - 520M yen × 35% = 182M yen/year
Investment: - Content production: 20M yen - AR simulator development: 15M yen - Total initial investment: 35M yen - Annual operating costs: 6M yen
ROI: - (182M - 6M) / 35M × 100 = 503% - Payback period: 35M ÷ 176M = 0.20 years (2.4 months)
Chapter 6: Detective's Diagnosis—Market Adaptation Through Rapid PDCA
That evening, I contemplated the essence of the OODA Loop.
Globex Corporation held plan-first thinking of "execute after perfect planning." But markets change constantly. While spending time on planning, opportunities are lost.
We started with Observe in the OODA Loop. Through consumer interviews, competitor analysis, and data analysis, we discovered the biggest anxiety: "don't know if it fits my room." With Orient, we defined the strategy: "proposal-based content + AR simulator." We implemented MVP with Decide & Act, then measured effects again with Observe.
Month 4 observation revealed a new finding: "low AR simulator usage rate." We revised strategy in Month 5 and far exceeded targets in Month 6. We rotated this loop 3 times in 5 months.
What's important is that we didn't seek perfection but rotated rapidly. Validate hypotheses with MVP, learn from observations, revise strategy. This repetition achieved annual sales increase of 520M yen, ROI of 503%, payback in 2.4 months.
"Don't make perfect plans. Rapidly rotate Observe-Orient-Decide-Act with the OODA Loop. By learning from and continuously adapting to the market, reproducible success emerges."
The next case will also depict the moment of dominating markets through rapid adaptation.
"OODA—Observe, Orient, Decide, Act. Prioritize observation over planning. By rapidly repeating hypothesis validation and continuously learning from the market, true success is achieved"—From the Detective's Notes
Related Files
🎖️ Top 3 Weekly Ranking of Case Files

'PharmaLogistics' Invisible Customer'

'PrintMaster's Visual Inspection Mental Hell'

'Global Solutions Inc.'s Triple-Entry Infinite Hell'