ROI Case File No.391 | 'QuantumGrocers' Lost Customer Data'
📅 2026-01-21 23:00
🕒 Reading time: 11 min
🏷️ 5W1H

- Chapter 1: The Outdated Weapon of Flyer Distribution—Invisible Customers, Unreadable Markets
- Chapter 2: The Illusion That Data Automatically Solves Everything—5W1H Is Not Organized
- Chapter 3: Phase 1—Organize Questions with 5W1H and Clarify Issues
- Chapter 4: Phase 2—Verify Reproducible Success Through Effect Measurement
- Chapter 5: The Detective's Diagnosis—Organizing Questions Is the Beginning of Everything
- Related Files
Chapter 1: The Outdated Weapon of Flyer Distribution—Invisible Customers, Unreadable Markets
The day after solving the TechnoSphere PDCA incident, a consultation arrived regarding data utilization for a supermarket chain. Episode 391 of Volume 32 "Reproducibility" is a story about organizing questions with 5W1H.
"Detective, we cannot see our customers. More precisely, customers pass through our registers. Three thousand people daily. Yet we don't know what they seek, why they chose our store, or when they'll return. We understand nothing. We distribute fifty thousand flyers, but we don't know who reads them."
QuantumGrocers Corporation's Marketing Director, Koji Tanaka from a shopping district background, visited 221B Baker Street with a troubled expression. In his hands, he clutched a bundle of faded flyers alongside a hopeful proposal titled "AI-Driven Retail Revolution 2026."
"We are a community-focused supermarket chain. Eight stores. Two hundred eighty employees. Annual revenue of 4.2 billion yen. Forty-five years in business. However, sales are declining. Down 8% year-over-year. At this rate, we'll be in the red in five years."
QuantumGrocers Corporation Current Status: - Established: 1981 (community-focused supermarket) - Number of stores: 8 - Number of employees: 280 - Annual revenue: 4.2 billion yen - Issues: Sales decline (YoY -8%), declining flyer effectiveness, unutilized customer data
Tanaka's voice carried deep anxiety.
"We know the cause. Flyers. We distribute fifty thousand flyers weekly. Printing costs, distribution costs, design costs. 2.4 million yen monthly. 28.8 million yen annually. However, effectiveness declines yearly. Ten years ago, the day after flyer distribution saw an average +35% increase in visitors. Now it's +8%. More people discard flyers without reading them."
Flyer Distribution Effectiveness Decline:
2016 (10 years ago): - Distribution volume: 50,000 sheets weekly - Next-day visitor increase rate: +35% - Monthly flyer cost: 2.4 million yen - Monthly sales increase: 12 million yen (from flyer effect) - ROI: (12 million - 2.4 million) / 2.4 million × 100 = 400%
2026 (current): - Distribution volume: 50,000 sheets weekly (unchanged) - Next-day visitor increase rate: +8% - Monthly flyer cost: 2.4 million yen (unchanged) - Monthly sales increase: 3.2 million yen (from flyer effect) - ROI: (3.2 million - 2.4 million) / 2.4 million × 100 = 33%
Changes over 10 years: - ROI: 400% → 33% (92% decrease) - Visitor increase rate: +35% → +8% (77% decrease)
Tanaka sighed deeply.
"Furthermore, competitive research is problematic. We have five competing stores in our trading area. AEON, Seiyu, Life, two local veteran supermarkets. Price competition is fierce. Staff visit competing stores weekly to survey prices. Two hours per store for surveys. Ten hours weekly for five stores. Forty hours monthly. Staff labor costs, 140,000 yen monthly. 1.68 million yen annually. Yet prices sometimes change the day after surveys."
Competitive Price Survey Reality:
Survey Process: - Survey staff: 2 people (rotating shifts) - Survey frequency: Once weekly (Mondays) - Survey targets: 5 stores × 200 main products - Survey time per store: 2 hours - Weekly survey time: 10 hours - Monthly survey time: 40 hours - Labor cost: 3,500 yen per hour × 40 hours = 140,000 yen/month
Survey Problems: - Surveys once weekly → Information outdated by week's end - Handwritten notes → 3 hours for Excel input - Cannot track price changes → Don't know when changes occur - Miss special sale information → Don't notice when competitors suddenly reduce prices
"And the biggest problem. Customer data. We have twelve thousand point card members. Purchase history recorded in POS data. However, we cannot utilize it. Data exists, but we're not examining it. Who bought what products. When they visit. We analyze nothing."
Held Data Reality:
Point Card Data: - Members: 12,000 - Average age: 52 - Gender ratio: Female 68%, Male 32% - Average visit frequency: 2.3 times weekly - Data items: Name, age, gender, address, phone number, email address
POS Data: - Product purchase history: Past 3 years (approximately 18 million records) - Data items: Purchase date/time, product name, category, price, quantity, member ID - Daily transactions: Approximately 16,000 (all 8 stores combined)
Current Data Utilization: - Analysis staff: 0 - Data review frequency: Monthly sales aggregation only - Customer segmentation: Not implemented - Personalization initiatives: Not implemented
"Data exists. However, we don't know what to do. We heard AI can solve this. But we don't know where to start. The path isn't visible."
Chapter 2: The Illusion That Data Automatically Solves Everything—5W1H Is Not Organized
"Tanaka-san, do you believe data automatically solves problems?"
At my question, Tanaka showed a confused expression.
"Eh, isn't that the case? I heard that if you give data to AI, it analyzes automatically."
Current Understanding (Data Omnipotence Type): - Expectation: Give data to AI → Solutions emerge automatically - Problem: What needs solving (the question) is not organized
I explained the importance of organizing questions with 5W1H.
"The problem is that 'what we want to solve' is unclear. 5W1H—Who, What, When, Where, Why, How. By organizing questions from these six perspectives, reproducible solutions become visible."
⬜️ ChatGPT | Concept Catalyst
"Don't rely on data. Organize questions with 5W1H and clarify the issues to solve"
🟧 Claude | Story Alchemist
"Problems always hide 'in the fog.' Using six lights called 5W1H to clear the fog is essential"
🟦 Gemini | Compass of Reason
"Apply the 6 steps of 5W1H. Who → What → When → Where → Why → How"
The three members began analysis. Gemini deployed the "5W1H Framework" on the whiteboard.
5W1H Framework: - Who: Who are the customers? - What: What needs solving? - When: When to solve it? - Where: Where to implement it? - Why: Why is solving necessary? - How: How to solve it?
"Tanaka-san, let's first organize questions with 5W1H."
Chapter 3: Phase 1—Organize Questions with 5W1H and Clarify Issues
Step 1: Who—Customer Segmentation (Week 1-2)
Question: "Who are our customers? Not all 12,000 are the same customer. Different segments should have different needs."
Analysis Process: - Analyze POS data (past 1 year, approximately 6 million records) - Segment using RFM analysis (Recency: Last purchase date, Frequency: Purchase frequency, Monetary: Purchase amount)
Segmentation Results:
| Segment | People | Percentage | Characteristics | Monthly Avg Purchase |
|---|---|---|---|---|
| VIP customers | 600 | 5% | Visit 3+ times weekly, purchase 50,000+ yen monthly | 68,000 yen |
| Regular customers | 2,400 | 20% | Visit twice weekly, purchase 30,000 yen monthly | 32,000 yen |
| General customers | 6,000 | 50% | Visit once weekly, purchase 15,000 yen monthly | 15,000 yen |
| Dormant customers | 3,000 | 25% | Once monthly or less, 5,000 yen or less monthly | 4,000 yen |
Important Findings: - VIP customers 600 (5%) account for 24% of total sales - Dormant customers 3,000 (25%) account for only 7% of total sales
Step 2: What—Identifying Issues to Solve (Week 2-3)
Question: "What needs solving? Declining flyer effectiveness? Price setting optimization? Customer churn prevention?"
Issue Prioritization:
Issue 1: Declining Flyer Distribution Effectiveness (Highest Priority) - Current: ROI 33% - Target: ROI 200%+ - Expected effect: 19.2 million yen annual revenue increase
Issue 2: Inefficient Competitive Price Surveys (Priority) - Current: 10 hours weekly manual work - Target: Reduce to 2 hours weekly through automation - Expected effect: 1.68 million yen annual labor cost reduction
Issue 3: Customer Churn Prevention (Medium Priority) - Current: 3,000 dormant customers - Target: Halve dormant customers to 1,500 - Expected effect: 18 million yen annual revenue increase
Step 3: When—Setting Implementation Timing (Week 3)
Question: "When to implement? All stores at once? Or gradually?"
Implementation Plan: - Month 1-2: Verify at 1 pilot store - Month 3-4: Expand to 3 stores if successful - Month 5-6: Deploy to all 8 stores
Step 4: Where—Selecting Implementation Location (Week 3)
Question: "Where to implement? Which store is optimal to start with?"
Pilot Store Selection Criteria: - Sales scale: Medium (average representative store) - Number of competitors: 3 stores (average competitive environment) - Point card members: 1,800 (average membership)
Selection Result: - Pilot store: Kasai Store (annual sales 520 million yen, 1,800 members)
Step 5: Why—Clarifying Solution Necessity (Week 4)
Question: "Why is solving necessary? Is maintaining the status quo unacceptable?"
Status Quo Scenario (5 years later): - Sales decline: 8% annual rate → Annual revenue 2.8 billion yen in 5 years (currently 4.2 billion) - Flyer ROI: 33% → Further decline to below 10% - Price gap with competitors: Expansion → Accelerated customer outflow - Result: High possibility of red ink
AI Introduction Scenario (5 years later): - Sales increase: +5% annual rate → Annual revenue 5.4 billion yen in 5 years - Flyer ROI: Maintain 200%+ - Immediate response to competitive prices → Customer retention - Result: Expanded profits
Step 6: How—Designing Solution Methods (Week 4-6)
Question: "How to solve? What specific tools and methods?"
Solution 1: AI Price Prediction System - Purpose: Automatically collect competitive prices and predict optimal prices - Technology: Web scraping + GPT-4 price prediction model - Implementation: - Automatically collect prices daily from 5 competitor websites - Analyze price trends for main 200 products - Calculate optimal prices combining demand forecasting - Expected Effects: - Price survey time: 10 hours weekly → 2 hours weekly (80% reduction) - Annual labor cost reduction: 1.34 million yen
Solution 2: Segment-Based Marketing - Purpose: Implement optimal measures for each segment - Technology: RFM analysis + Personalized email distribution - Implementation: - VIP customers (600): Advance notice of limited products - Regular customers (2,400): Double point day announcements - General customers (6,000): Weekend special sale information - Dormant customers (3,000): Return coupon (500 yen discount) - Expected Effects: - Flyer distribution: 50,000 sheets → Reduce to 10,000 sheets (80% reduction) - Email distribution: 0 yen → 50,000 yen monthly (low cost) - Flyer ROI: 33% → Improve to 210%
Chapter 4: Phase 2—Verify Reproducible Success Through Effect Measurement
Month 3: Effect Measurement at Pilot Store
KPI1: Flyer Distribution Effectiveness Improvement
| Indicator | Before | After | Improvement |
|---|---|---|---|
| Weekly distribution | 6,250 sheets | 1,250 sheets | 80% reduction |
| Monthly cost | 300,000 yen | 60,000 yen | 80% reduction |
| Visitor increase rate | +8% | +28% | +250% |
| Monthly sales increase | 400,000 yen | 1,260,000 yen | +215% |
| ROI | 33% | 210% | +535% |
KPI2: Price Survey Efficiency
| Indicator | Before | After | Improvement |
|---|---|---|---|
| Weekly survey time | 10 hours | 2 hours | 80% reduction |
| Monthly labor cost | 140,000 yen | 28,000 yen | 80% reduction |
| Price data update frequency | Once weekly | Daily | - |
KPI3: Dormant Customer Return
| Indicator | Before | After | Improvement |
|---|---|---|---|
| Dormant customers | 450 | 270 | 40% reduction |
| Monthly purchases from returned customers | 0 yen | 180 × 15,000 yen = 2,700,000 yen | - |
Month 6: Annual Effects After Full Store Deployment
Annual Effects (All 8 Stores):
Flyer Cost Reduction: - Before: 2.4 million yen monthly × 12 months = 28.8 million yen/year - After: 480,000 yen monthly × 12 months = 5.76 million yen/year - Reduction: 23.04 million yen/year
Revenue Increase from Improved Flyer Effectiveness: - Pilot store results: +860,000 yen monthly (1,260,000 - 400,000) - All 8 stores: +6.88 million yen monthly - Annual: +82.56 million yen
Labor Cost Reduction from Price Surveys: - Reduction: 1.34 million yen/year
Revenue Increase from Dormant Customer Return: - Pilot store results: +2.7 million yen monthly - All 8 stores: +21.6 million yen monthly - Annual: +259.2 million yen
Total Annual Effect: - Cost reduction: 23.04 million + 1.34 million = 24.38 million yen - Revenue increase: 82.56 million + 259.2 million = 341.76 million yen - Total: 366.14 million yen
Investment: - AI system development: 8 million yen - Email distribution system: 50,000 yen monthly × 12 months = 600,000 yen - Data analysis staff 1 person: 6 million yen annually - Total initial investment: 14.6 million yen
ROI: - (366.14 million - 600,000) / 14.6 million × 100 = 2,407% - Investment recovery period: 14.6 million ÷ 365.54 million = 0.04 years (approximately 2 weeks)
Chapter 5: The Detective's Diagnosis—Organizing Questions Is the Beginning of Everything
That night, I contemplated the essence of 5W1H.
QuantumGrocers held the illusion that "data automatically solves everything." However, data alone solves nothing. What's important is clarifying the question "what do we want to solve?"
We organized questions with 5W1H. Who (customer segments), What (flyer effectiveness and data utilization), When (phased deployment), Where (pilot store), Why (response to sales decline), How (AI price prediction and personalization).
As a result of organizing questions from six perspectives, we achieved annual effects of 366.14 million yen, ROI of 2,407%, and investment recovery in 2 weeks.
What's important is not "the latest AI tools" but "setting the right questions." By organizing questions with 5W1H, data first creates value. Reproducible success begins with organizing questions.
"Don't rely on data. Organize questions with 5W1H and clarify the issues to solve. Problems hidden in the fog only reveal themselves when illuminated by six lights. Reproducible success begins with clarifying questions."
The next incident will also depict the moment of organizing questions.
"5W1H—Who, What, When, Where, Why, How. Organize questions from these six perspectives. Data doesn't teach answers. Only when questions are clarified does data create value."—From the detective's notes
Related Files

🎖️ Top 3 Weekly Ranking of Classified Case Files
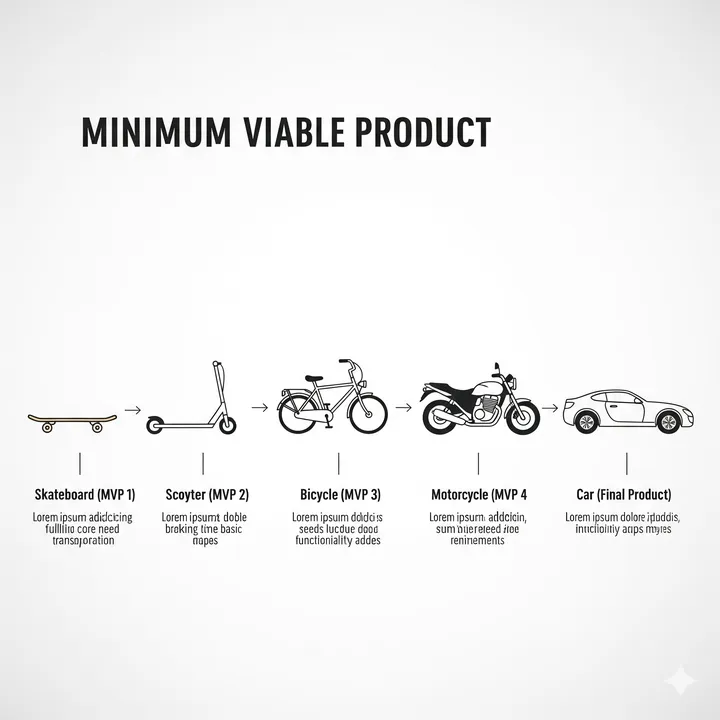
What is MVP
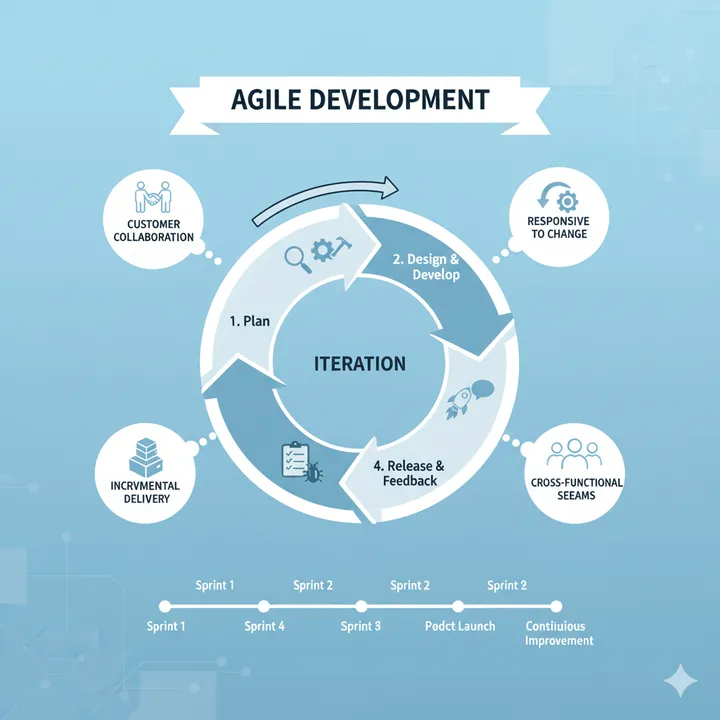
What is Agile Development
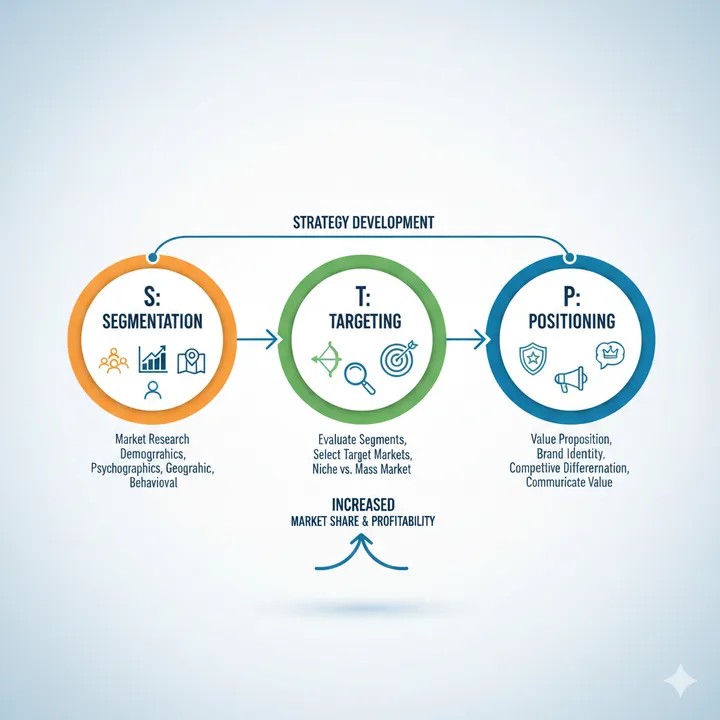
What is STP Analysis