ROI【🔒Classified File】 No. X039 | What is the HEART Framework
📅 2025-10-06
🕒 Reading time: 27 min
🏷️ HEART 🏷️ Learning 🏷️ 【🔒Classified File】
- What is the HEART Framework - Case Overview
- Basic Structure of the HEART Framework - Evidence Analysis
- HEART Implementation Procedures - Investigation Methods
- Power of the HEART Framework - Hidden Truths
- HEART Framework Limitations and Cautions - Potential Dangers
- HEART Framework Applications and Related Methods - Related Case Files
- Industry-Specific HEART Use Cases - Special Evidence
- HEART Dashboard Design - Implementation Guide
- Organizational Preparation for HEART Implementation - Special Investigation
- HEART vs Other UX Measurement Methods - Comparative Analysis
- HEART Success Metrics and Effect Measurement - Evaluation System
- Advanced Applications of HEART - Advanced Techniques
- Future and Evolution of HEART - Outlook Analysis
- Conclusion - Investigation Summary
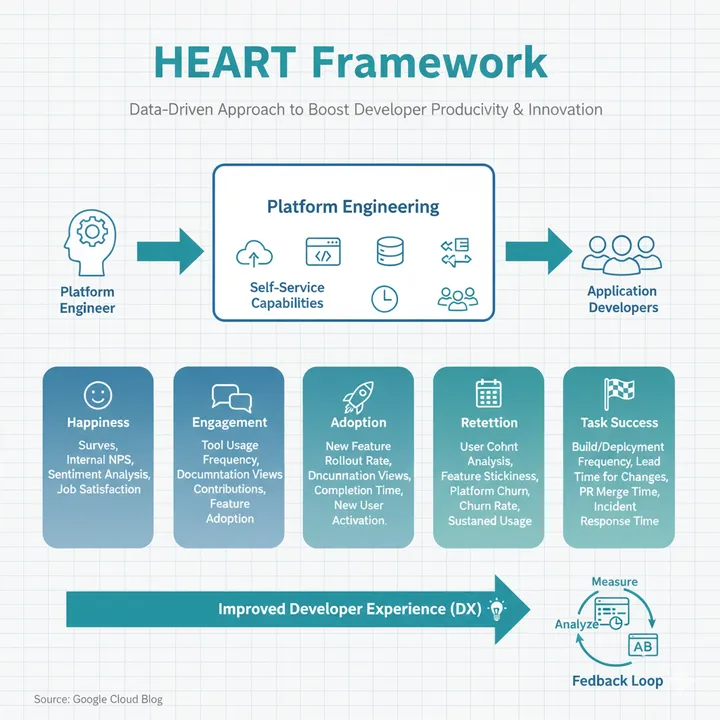
Detective Memo: The revolutionary UX measurement system "HEART Framework" developed by Google. While many mistakenly perceive it as merely a "user satisfaction survey," its true identity is a "5-dimensional evaluation system that quantitatively measures and improves qualitative experiences." Why can Google quantify the ambiguous concept of "usability," and what is the reason YouTube, Gmail, and Google Maps can continuously improve user experience? Happiness, Engagement, Adoption, Retention, Task Success—a transformation from subjective evaluation to scientific improvement woven by five dimensions. Uncover the identity of the measurable UX improvement cycle created by the three-stage design of Goals-Signals-Metrics.
What is the HEART Framework - Case Overview
The HEART Framework, formally known as the "5-Dimensional Quantitative UX Assessment Method," was published by the Google Research team in 2010 as a UX measurement theory. Through five metric axes—Happiness, Engagement, Adoption, Retention, and Task Success—it is recognized among clients as a methodology that quantifies the previously difficult-to-measure "quality of user experience" and enables continuous, data-driven improvement. However, in actual practice, it is often superficially understood as "systematized questionnaire surveys," with most companies failing to grasp its true systematic value: strategic measurement design through a three-layer structure of Goals-Signals-Metrics and multifaceted analysis across product-level, feature-level, and user-segment perspectives.
Investigation Memo: HEART is not merely a "satisfaction metric" but a "health diagnostic system for user experience." Why is a single metric (e.g., revenue) insufficient, and what becomes visible when measuring from five different perspectives? We must elucidate this modern product development measurement foundation that refines the "Measure" in MVP's Build-Measure-Learn cycle and quantitatively strengthens Agile Development's sprint reviews.
Basic Structure of the HEART Framework - Evidence Analysis
Fundamental Evidence: Comprehensive measurement of user experience through 5 dimensions
HEART - 5 Measurement Dimensions
H: Happiness (Satisfaction)
Definition: Users' subjective satisfaction and emotional responses
Measurement targets: - Product satisfaction - Recommendation intent (NPS) - Usage feelings and impressions - Brand perception
Typical measurement methods: - Survey questionnaires - NPS (Net Promoter Score) - Satisfaction Score (CSAT) - Reviews and ratings - Social media analysis
Importance: - Leading indicator of long-term loyalty - Prediction of word-of-mouth and referrals - Measurement of brand value - Understanding emotional connections
Cautions: - Subjective and susceptible to bias - May not correlate with immediate behavioral changes - Cultural and linguistic interpretation differences
E: Engagement (Involvement)
Definition: Depth of users' involvement and usage with the product
Measurement targets: - Usage frequency and duration - Feature usage status - Content consumption volume - Number of interactions
Typical measurement methods: - DAU/WAU/MAU (Daily/Weekly/Monthly Active Users) - Session time and frequency - Page views - Action completion count - Stickiness (DAU/MAU ratio)
Importance: - Measurement of product stickiness - Quantification of user value - Monetization potential - Product-market fit indicator
Cautions: - High engagement ≠ good experience - May include forced involvement (e.g., revisits to fix bugs) - Excessive use may indicate dependency or addiction
A: Adoption (Onboarding Rate)
Definition: Initial usage rate of new features or products
Measurement targets: - New user acquisition numbers - First-time usage rate of new features - Onboarding completion rate - Reach rate to key features
Typical measurement methods: - New registration numbers - First-time feature usage rate - Onboarding step completion rate - Activation rate - "Aha moment" achievement rate
Importance: - Indicator of growth and scalability - Measurement of initial UX effectiveness - Verification of marketing effectiveness - Initial evaluation of feature value
Cautions: - Adoption ≠ continued usage - Quality of first experience is critical - Segment-specific analysis essential
R: Retention (Continuity Rate)
Definition: Users' continued usage of the product
Measurement targets: - User revisits and reuse - Long-term usage continuation - Churn (cancellation/abandonment) rate - Cohort analysis
Typical measurement methods: - Retention rate (1-day, 7-day, 30-day after) - Churn rate (monthly, annual) - Repeat purchase rate - Subscription renewal rate - Cohort retention curves
Importance: - Business sustainability - Foundation of LTV (Customer Lifetime Value) - Product-market fit validation - Key to long-term growth
Cautions: - Benchmark values differ by industry and product type - Early retention and long-term retention are separate metrics - Need to exclude zombie users (registered but unused)
T: Task Success (Efficiency)
Definition: Degree to which users can complete intended tasks
Measurement targets: - Task completion rate - Error occurrence rate - Completion time - Efficiency
Typical measurement methods: - Task completion rate (%) - Task completion time - Error count and error rate - Search success rate - Conversion rate - Abandonment rate (mid-task dropout)
Importance: - Direct measurement of usability - Validation of functional value - Early detection of UX issues - Direct connection to ROI
Cautions: - Task definition is critical - Understanding user intent is prerequisite - Complex tasks should be measured in decomposed form
Evidence Analysis: The innovation of the HEART Framework lies in converting "subjective user experience" into "objective 5-dimensional metrics" and making it measurable and improvable through systematic design of Goals-Signals-Metrics.
Goals-Signals-Metrics 3-Layer Structure
Systematic Process of HEART Measurement Design
Level 1: Goals
Clarification of "what we want to achieve"
Examples: - Users are satisfied with the product - Users frequently use the product - New features are actively adopted - Users continue long-term usage - Users can efficiently complete tasks
Level 2: Signals
Identification of "what are the signs of goal achievement"
Examples (for Happiness goal): - Users write positive reviews - Give high rating scores - Recommend to friends - Negative feedback decreases
Level 3: Metrics
Definition of "how to measure signals"
Examples (for above signals): - NPS (Net Promoter Score) - Average 5-point satisfaction score - Average App Store star rating - Reduction rate in support inquiries
Power of the 3-Layer Structure:
Traditional problem: "Want to increase satisfaction" → "Unclear what/how to measure" → "Random survey implementation" → "No improvement"
HEART Approach: Goals: Users are satisfied with the product ↓ Signals: Users recommend to friends ↓ Metrics: Target NPS ≥ 50 ↓ Clear goal-measurement-improvement cycle established
Flexibility in HEART Application
Not All Metrics Need to Be Used
Selection by product type and phase:
New Product (Launch Phase): Focus: Adoption, Task Success Reason: First get users to try and experience value
Growth Phase Product: Focus: Engagement, Retention Reason: Continued usage and habit formation are keys to growth
Mature Phase Product: Focus: Happiness, Retention Reason: Long-term loyalty and differentiation are important
Feature Addition: Focus: Adoption, Task Success Reason: Value validation of new features is priority
Crisis Response: Focus: Retention, Happiness Reason: Preventing user churn is urgent issue
Importance of Segment-Specific Measurement
By user type: - New users vs veteran users - Free users vs paid users - Power users vs light users
HEART metrics differ for each segment → Overall averages alone overlook problems
HEART Implementation Procedures - Investigation Methods
Investigation Finding 1: Google Search Practical Case Study
Case Evidence (UX Measurement of World's Largest Search Engine):
Phase 1: Goals Setting (1 week)
Product Vision: "Users can find the information they seek fastest and optimally"
HEART Goals Setting:
Happiness: - Users are satisfied with search results
Engagement: - Users frequently use search
Adoption: - New features (voice search, image search, etc.) are used
Retention: - Users continue to use Google
Task Success: - Users efficiently find the information they seek
Phase 2: Signals Identification (2 weeks)
Happiness Signals: - Users click on search results - Users don't immediately return (sign of satisfaction) - Users send positive feedback
Engagement Signals: - Users search multiple times per day - Users search with various queries - Users deeply explore search results
Adoption Signals: - Users try new features - Users reuse new features
Retention Signals: - Users search the next day/week - Users continue using Google as first choice
Task Success Signals: - Users achieve goals in 1-2 clicks - Users don't repeat searches (first-time success) - Users don't reach error pages
Phase 3: Metrics Definition (2 weeks)
Happiness Metrics: - Search satisfaction survey (5-point scale) average score - NPS (Net Promoter Score) - "Not helpful" feedback rate
Engagement Metrics: - DAU (Daily Active Users) - Average searches per user per day - Average queries per session
Adoption Metrics: - Voice search usage rate (% of all searches) - First-time image search usage rate - Weekly growth rate of new features
Retention Metrics: - 1-day retention rate - 7-day retention rate - 30-day retention rate - Monthly churn rate
Task Success Metrics: - Click-through rate (CTR) - Average click position - Immediate re-search rate (Long Click / Short Click ratio) - Task completion time
Phase 4: Measurement & Analysis (Continuous)
Weekly Reports: - Trends in each HEART metric - Week-over-week, year-over-year comparisons - Segment-specific analysis
Monthly Reviews: - Trend analysis - Investigation of anomalies and sudden changes - Verification of improvement initiative effectiveness
Quarterly Evaluations: - Goal achievement assessment - Strategic direction review - Next quarter goal setting
Phase 5: Improvement Cycle (Continuous)
Problems Discovered (example): - Task Success decline: Inappropriate search results for specific queries - Engagement decline: Poor mobile search experience - Adoption stagnation: Low awareness of new features
Improvement Implementation: - Algorithm improvements (search quality enhancement) - Mobile UX improvements (speed, UI optimization) - Strengthened new feature promotion
Effect Measurement: - Before/after HEART metric comparison - A/B testing for effect validation - User feedback collection
Results: - Task Success: +15% improvement - Engagement: Mobile DAU +20% increase - Adoption: New feature usage rate +30% improvement
Investigation Finding 2: SaaS Product Implementation Case Study
Case Evidence (6 months with Project Management Tool):
Background:
Product: Project management SaaS for small-medium enterprises Challenge: "Want to improve UX" but unclear what specifically to do Traditional measurement: Only revenue and registrations (not measuring experience quality)
Phase 1: HEART Design (1 month)
Goals Setting:
H: Users are satisfied with the tool and want to recommend to their team E: Users use the tool daily, forming task management habits A: New users create their first project immediately after registration R: Users continue usage after 1 month and convert to paid T: Users efficiently execute task creation, assignment, and completion
Signals Identification:
H: Team invitations/recommendations, high-rating reviews E: Daily logins, task creation/updates, comments A: Project creation within 24 hours of registration, key feature usage R: Active usage after 7 days/30 days, paid plan selection T: Task creation completion, no errors encountered, successful searches
Metrics Definition:
H: NPS, 5-point satisfaction, App Store review average stars E: DAU/MAU, weekly actions per user A: 24-hour project creation rate, key feature reach rate R: 7-day retention, 30-day retention, MRR T: Task creation completion rate, average task creation time, error rate
Phase 2: Measurement Infrastructure (1 month)
Implementation: - Google Analytics 4 event tracking setup - Mixpanel integration (user behavior analysis) - Regular satisfaction survey distribution (Intercom) - Dashboard creation (Looker Studio)
Measurement Start: - Automatic collection of all HEART metrics - Automated weekly report generation - Alert settings (detecting rapid changes)
Phase 3: Baseline Measurement (1 month)
Initial Measurement Results:
Happiness: - NPS: 32 (low compared to industry average of 45) - Satisfaction: 3.4/5.0 - App Store: 3.8★/5.0
Engagement: - DAU/MAU: 0.25 (used 3-4 days per week) - Weekly actions: 15 times/user
Adoption: - 24-hour project creation: 42% - Key feature reach rate: 58%
Retention: - 7-day: 45% - 30-day: 22% - MRR growth rate: +8%/month
Task Success: - Task creation completion rate: 78% - Average task creation time: 45 seconds - Error rate: 12%
Challenge Clarification: → Particularly low Happiness, Adoption, and Retention → High Task Success error rate
Phase 4: Improvement Implementation (3 months)
Prioritization: 1. Task Success improvement (basic experience enhancement) 2. Adoption improvement (initial experience optimization) 3. Retention improvement (continued usage promotion)
Sprint 1-2: Task Success Improvement
Initiatives: - Simplified task creation UI - Improved error messages - Added keyboard shortcuts - Created tutorial videos
Results (2 months later): - Task creation completion rate: 78% → 92% (+18%) - Average creation time: 45 sec → 28 sec (-38%) - Error rate: 12% → 4% (-67%)
Sprint 3-4: Adoption Improvement
Initiatives: - Redesigned onboarding flow - Provided templates (immediately usable projects) - Displayed "what to do next" guide - Presented success stories and best practices
Results (3 months later): - 24-hour project creation: 42% → 68% (+62%) - Key feature reach rate: 58% → 81% (+40%)
Sprint 5-6: Retention Improvement
Initiatives: - Optimized reminders and notifications - Weekly progress report email distribution - Strengthened team collaboration features - Clarified paid plan value
Results (4 months later): - 7-day retention: 45% → 62% (+38%) - 30-day retention: 22% → 38% (+73%) - MRR growth rate: +8% → +18%/month
Phase 5: Continuous Measurement & Improvement (Ongoing)
Overall Results After 6 Months:
Happiness: - NPS: 32 → 54 (+69%) - Satisfaction: 3.4 → 4.2/5.0 (+24%) - App Store: 3.8★ → 4.5★ (+18%)
Engagement: - DAU/MAU: 0.25 → 0.42 (+68%) - Weekly actions: 15 → 28 times (+87%)
Adoption: - 24-hour project creation: 42% → 68% (+62%) - Key feature reach rate: 58% → 81% (+40%)
Retention: - 7-day: 45% → 62% (+38%) - 30-day: 22% → 38% (+73%) - MRR growth rate: +8% → +18%/month (+125%)
Task Success: - Task creation completion rate: 78% → 92% (+18%) - Average task creation time: 45 sec → 28 sec (-38%) - Error rate: 12% → 4% (-67%)
Business Impact: - New registrations: +45% increase - Paid conversion rate: 18% → 28% (+56%) - Churn rate: 8% → 4%/month (-50%) - Annual Recurring Revenue (ARR): +120% growth
Investigation Finding 3: Segment-Specific HEART Analysis
Important Discovery: Problems invisible in overall averages
New Users: - Adoption: High (novelty and expectations) - Task Success: Low (unfamiliar with operations) - Retention: Very low (abandonment from initial experience) → Countermeasure: Strengthen onboarding, improve tutorials
Veteran Users: - Task Success: High (familiar with operations) - Engagement: Very high (habitualized) - Happiness: Moderate (stagnation) → Countermeasure: Provide new features, add advanced functions
Free Users: - Adoption: High (trial willingness) - Engagement: Low (low necessity) - Retention: Low (insufficient value realization) → Countermeasure: Clarify value, create path to paid plans
Paid Users: - Engagement: Very high (business essential) - Happiness: High (ROI realization) - Retention: Very high (switching costs) → Countermeasure: Expand premium features, VIP treatment
Segment-specific optimization maximizes overall effectiveness
Power of the HEART Framework - Hidden Truths
Warning File 1: Organizational Improvement Through UX Visualization & Quantification
Transforms vague goals like "let's improve usability" into specific numerical targets, enabling organization-wide UX improvement activities. Executive leadership, development, design, and marketing can discuss and make decisions with a common language.
Warning File 2: Balanced Multifaceted Evaluation
Single metrics (e.g., revenue only) miss the essence. For example, if revenue increases but Happiness decreases, it's a sign of future crisis. Measuring in 5 dimensions reveals trade-offs, balance, and overall optimization.
Warning File 3: Early Problem Detection & Prevention
If you respond when Retention starts declining, you can still manage, but if you wait until revenue drops, it's too late. HEART functions as leading indicators that change before lagging indicators like revenue and profit, serving as an early warning system.
Warning File 4: Effect Measurement & Validation of Improvement Initiatives
Not "the UI change seems better," but objective effect validation through HEART metric changes. Combined with A/B testing, establishes a scientific UX improvement cycle.
HEART Framework Limitations and Cautions - Potential Dangers
Warning File 1: Risk of Measuring for Measurement's Sake
The greatest danger. HEART metric collection becomes the goal, creating a "measurement bubble" state that doesn't lead to actual UX improvement. Risk of just looking at numbers and being satisfied without solving users' real challenges.
Warning File 2: Qualitative Aspects Not Captured by Quantitative Metrics Alone
"Stress during use," "subtle discomfort," and "latent dissatisfaction" not reflected in numbers can only be discovered through qualitative research (user interviews, observation). Relying solely on HEART overlooks important insights.
Warning File 3: Metric Optimization Causing Counterproductive Effects That Harm User Value
Example: Increasing notifications to improve Engagement → Users find it annoying → Happiness decreases. Obsessing over raising metrics while losing sight of the original purpose (user value) puts the cart before the horse.
Warning File 4: Wrong Judgments from Insufficient Segment Analysis
Looking only at overall averages hides problems as "new user churn" and "veteran user high engagement" cancel each other out. Cannot discover true challenges without segment-specific analysis.
Warning File 5: Short-Term Metric Optimization Damaging Long-Term Value
"Exaggerated advertising" to increase Adoption → Retention decreases due to gap with expectations. Risk of destroying long-term trust and brand value by obsessing over short-term numerical improvements.
HEART Framework Applications and Related Methods - Related Case Files
Related Evidence 1: Integrated Use with MVP
Minimum Viable Product × HEART: - Build → Create MVP - Measure → Measure HEART metrics - Learn → Learn and improve from metrics
Refine MVP's "Measure" phase with HEART Accelerate Build-Measure-Learn cycle with HEART
Related Evidence 2: Fusion with Agile Development
Sprint × HEART: - Sprint goal → HEART metric improvement goals - Sprint review → Confirm HEART metric changes - Retrospective → Analyze causes of metric changes
Integrate HEART measurement into Agile sprint cycles Measure and improve HEART metrics every 2 weeks
Related Evidence 3: Goal Setting with OKR
Objective Management × HEART: Objective: Improve user experience Key Results: - Achieve NPS 50 or higher (Happiness) - Achieve DAU/MAU 0.4 or higher (Engagement) - Achieve 30-day retention 40% or higher (Retention) - Achieve task completion rate 90% or higher (Task Success)
Concretize OKR Key Results with HEART metrics Set and evaluate quarterly HEART goals
Related Evidence 4: Enhanced Coordination with AARRR
Pirate Metrics × HEART: Acquisition → Adoption (new acquisition, first usage) Activation → Task Success (value realization) Retention → Retention (continued usage) Revenue → (Monetization) Referral → Happiness (recommendation, referral)
Measure each stage of AARRR funnel with HEART Integration of growth hacking and UX improvement
Related Evidence 5: Experience Design with Customer Journey
Customer Journey × HEART: - Awareness stage → Prepare for Adoption measurement - Consideration stage → Emphasize initial Task Success - Purchase/usage start → Adoption, Task Success - Continued usage → Engagement, Retention - Recommendation/diffusion → Happiness, NPS
Set appropriate HEART metrics for each journey stage Touchpoint-specific experience optimization
Industry-Specific HEART Use Cases - Special Evidence
Related Evidence 6: YouTube (Video Platform)
HEART Implementation:
Happiness: - Video ratings (Like/Dislike ratio) - Comment sentiment analysis - Post-viewing satisfaction surveys
Engagement: - Watch Time - Videos per session - Comments, shares, saves count - Channel subscriptions
Adoption: - First-time usage rate of new features (Shorts, Live, etc.) - Creator tool adoption rate
Retention: - Daily/weekly/monthly active rates - Viewing habit continuity - Churn rate
Task Success: - Search → viewing completion rate - Recommended video click rate - "Found the video I was looking for" rate
Improvement Examples: - Recommendation algorithm improvement → Engagement +25% - UI simplification → Task Success +18% - Notification optimization → Retention +12%
Related Evidence 7: Slack (Business Chat)
HEART Implementation:
Happiness: - NPS (Net Promoter Score) - "Work became more enjoyable" agreement rate - Team recommendation rate
Engagement: - DAU (Daily Active Users) - Messages sent per user - Channel participation count - Reaction and thread usage frequency
Adoption: - First team invitation rate after workspace creation - First-time usage rate of new features (Huddle, Canvas, etc.) - Integration addition rate
Retention: - Team monthly active rate - Paid plan continuation rate - Weekly usage days
Task Success: - Message sending success rate - Search success rate (finding desired information) - File sharing completion rate
Distinctive Metrics: - "2,000 Message Rule" → Teams that send 2,000 messages have 93% retention → Engagement and Retention milestone KPI
Related Evidence 8: Duolingo (Language Learning App)
HEART Implementation:
Happiness: - Learning enjoyment rating - App Store reviews - Social media mentions
Engagement: - DAU (consecutive learning days - streak) - Learning sessions per day - Lessons completed - League and challenge participation rate
Adoption: - First lesson completion rate - Habituation rate within 5 days - Paid (Super Duolingo) conversion rate
Retention: - Consecutive learning days (streak maintenance rate) - 7-day/30-day active rates - Long-term learners (6+ months) rate
Task Success: - Lesson accuracy rate - Target language level achievement rate - Skill acquisition completion rate
Gamification × HEART: - Streak feature → Engagement and Retention improvement - League system → Engagement and Happiness improvement - Adaptive difficulty → Task Success and Happiness improvement
HEART Dashboard Design - Implementation Guide
Related Evidence 9: Effective Dashboard Configuration
Level 1: Executive Dashboard (For Leadership)
Display Content: - HEART 5 metrics summary (current month, month-over-month, vs. target) - Trend graphs (past 12 months) - Critical alerts (rapid changes) - Business impact (correlation with revenue and growth rate)
Update Frequency: Weekly Purpose: Overall situation awareness, strategic judgment
Level 2: Product Manager Dashboard
Display Content: - Detailed HEART metrics (by segment, by feature) - Funnel analysis (Adoption → Retention) - A/B test results - Integrated user feedback
Update Frequency: Daily Purpose: Detailed analysis, improvement initiative planning
Level 3: Engineer & Designer Dashboard
Display Content: - Task Success details (by feature, by screen) - Error logs and performance - Usability test results - Technical metrics (loading time, etc.)
Update Frequency: Real-time Purpose: Problem discovery, rapid response
Recommended Tools: - Looker Studio (Google) - Tableau - Mixpanel - Amplitude
Related Evidence 10: Alert & Anomaly Detection System
Automatic Alert Settings:
Critical (Urgent Response Required): - Retention decline of 20%+ (week-over-week) - Task Success error rate doubled or more - NPS decline of 10+ points - DAU sudden decrease of 30%+
Warning (Attention, Enhanced Monitoring): - Any HEART metric fluctuation of 10%+ - Rapid changes in specific segments - New feature Adoption stagnation
Info (Information Sharing): - Goal achievement - Positive trends - Unexpectedly good results
Response Process: 1. Alert detection → Immediate stakeholder notification 2. Cause investigation (data deep dive, log analysis) 3. Emergency response meeting (as needed) 4. Improvement initiative implementation 5. Effect measurement and follow-up
Organizational Preparation for HEART Implementation - Special Investigation
Related Evidence 11: Phased Introduction Approach
Phase 1: Pilot Implementation (1-2 months)
Target: One product or feature Activities: - Goals-Signals-Metrics design - Measurement infrastructure (minimal) - Baseline measurement - Small-scale improvement experiments
Deliverables: - HEART measurement demonstration - Effect case creation - Learning and know-how accumulation
Phase 2: Expansion (3-6 months)
Target: All major products Activities: - HEART design for all products - Full-scale measurement infrastructure - Dashboard preparation - Cross-team utilization start
Deliverables: - Organizational HEART culture - Standard process establishment - Continuous improvement cycle
Phase 3: Maturation & Optimization (Continuous)
Activities: - Advanced segment-specific analysis - Predictive model construction - Automation and AI utilization - Best practice sharing
Success Factors: - Executive commitment - Accumulation of small successes - Data culture cultivation - Cross-functional cooperation
Related Evidence 12: Necessity of Organizational Culture Transformation
Data-Driven Culture Cultivation:
Traditional Problems: - "Somehow" or "gut feeling" decision-making - HIPPO (Highest Paid Person's Opinion) judgments - Direction determined by subjectivity, emotion, politics
Transformation Through HEART Introduction: - Objective discussion based on data - Experimentation and validation-based decision-making - User-centered evaluation criteria
Required Organizational Changes:
Mindset: - "Done after creation" → "Measurement and improvement are the main event" - "Intuition and experience" → "Data and experimentation" - "Perfectionism" → "Continuous improvement"
Skills: - Data analysis literacy - Statistical thinking - Hypothesis validation capability - Storytelling (insights from data)
Process: - Regular HEART reviews - Data-based decision-making meetings - Experimentation and A/B test culture - Failure tolerance and learning emphasis
Evaluation System: - HEART improvement as evaluation metrics - Praise data-driven behavior - Encourage experimentation and learning
HEART vs Other UX Measurement Methods - Comparative Analysis
Related Evidence 13: Systematic Comparison of Measurement Methods
HEART vs NPS (Net Promoter Score):
NPS: - Single metric (recommendation only) - Simple and easy to understand - Abundant benchmarks - However, only one aspect of Happiness
HEART: - Comprehensive 5-dimensional measurement - Complex but detailed - Balance and trade-off visualization - Few benchmarks
Usage: NPS as one of HEART's Happiness metrics
HEART vs CSAT (Customer Satisfaction Score):
CSAT: - Transaction-specific or experience-specific satisfaction - Timely and concrete - However, short-term and localized
HEART: - Continuous measurement of overall product - Long-term trend understanding - Strategic decision-making
Usage: CSAT for measuring Happiness and Task Success of specific features
HEART vs CES (Customer Effort Score):
CES: - Measurement of task completion effort - Direct usability measurement - However, focuses only on effort
HEART: - Measures effort and efficiency with Task Success - Additionally measures satisfaction and continuity
Usage: CES for detailed Task Success measurement
HEART vs Google Analytics (GA4):
GA4: - Detailed behavior data tracking - Rich technical and quantitative data - However, "why" is unclear
HEART: - Integrated measurement of behavior + attitudes - Linkage with business goals - Concurrent qualitative research to explore "why"
Integrated Use: GA4 as HEART's data source
HEART Success Metrics and Effect Measurement - Evaluation System
Related Evidence 14: Quantitative Evaluation of HEART Introduction Effects
Introduction Effect Measurement Framework:
Level 1: Improvement of HEART Metrics Themselves Measurement: - Improvement rate of each HEART metric - Goal achievement degree - Trend improvement
Example: - NPS: 32 → 54 (+69%) - 30-day Retention: 22% → 38% (+73%) - Task completion rate: 78% → 92% (+18%)
Level 2: Impact on Business Metrics Measurement: - Revenue growth rate - Customer Acquisition Cost (CAC) reduction - Customer Lifetime Value (LTV) improvement - Churn rate decline
Example: - MRR growth rate: +8% → +18%/month - Paid conversion rate: 18% → 28% - CAC: -25% reduction - LTV: +40% improvement
Level 3: Organizational Outcomes Measurement: - Increase in data-driven decision-making - Number of UX improvement initiatives executed - Cross-functional cooperation degree - Team autonomy and speed
Example: - Data-based decisions: 30% → 80% - A/B test frequency: 5/month → 20/month - Initiative execution speed: -40% reduction
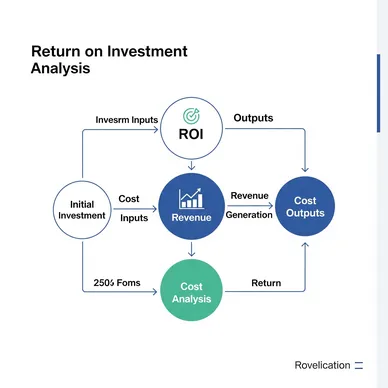
ROI Calculation:
Investment (Costs): - Tool introduction costs - Personnel costs (analysis and improvement) - Education and training
Returns (Benefits): - Revenue increase - Cost reduction (CAC, support, etc.) - Risk avoidance (churn prevention)
ROI = (Benefits - Costs) / Costs × 100%
Typical ROI: 300-500% (3-5x return on investment)
Advanced Applications of HEART - Advanced Techniques
Related Evidence 15: Integration with Predictive Analytics & Machine Learning
HEART × AI/ML:
-
Retention Prediction Model Input: Initial HEART metrics (first 7 days) Output: 30-day and 90-day retention probability Use: Proactive measures for high-churn-risk users
-
Automatic Segment Discovery Input: All users' HEART metric patterns Output: Clustering of similar behavior patterns Use: Identification of undiscovered user segments
-
Optimization Recommendation Engine Input: Current HEART metrics, past improvement initiative effects Output: Priority ranking of next initiatives to implement Use: Data-driven initiative prioritization
-
Anomaly Detection & Early Warning Input: Real-time HEART metric stream Output: Detection of deviations from normal patterns Use: Immediate problem discovery and response
Implementation Technologies: - Python (scikit-learn, TensorFlow) - SQL (BigQuery, Redshift) - BI Tools (Looker, Tableau) - MLOps (Vertex AI, SageMaker)
Related Evidence 16: Integration with Cohort Analysis
HEART × Cohort Analysis:
Time-Series Cohort Analysis: - HEART metric trends by registration month - Measurement of improvement initiative sustainability - Long-term trend understanding
Example: January 2024 Registration Cohort: - First month Retention: 45% - After 3 months: 35% - After 6 months: 28%
July 2024 Registration Cohort (after improvements): - First month Retention: 62% - After 3 months: 52% - After 6 months: 45%
→ Quantitative proof of long-term effects of improvement initiatives
Feature-Specific Cohorts: - Specific feature users vs non-users - Quantitative evaluation of feature value
Example: "Project Template" Usage Cohort: - 7-day Retention: 75% vs 45% (non-users) - Task success rate: 95% vs 78% - NPS: 68 vs 42
→ Objective judgment of feature value and priority
Future and Evolution of HEART - Outlook Analysis
Related Evidence 17: Next-Generation HEART Methods
Real-Time HEART: Current: Weekly/monthly aggregation and analysis Future: Real-time stream processing - Metric updates every second - Immediate anomaly detection and response - Live dashboards
Personalized HEART: Current: Measurement by segment averages Future: Individual-level prediction and optimization - Recommend feature X to user A - Apply improvement initiative Y to user B - 1-to-1 UX optimization
Multimodal HEART: Current: Primarily in-app behavior data Future: Integration of multiple data sources - Voice, facial expressions, gaze (emotion AI) - Wearable and biometric data - Environmental and contextual information
Auto-Improvement HEART: Current: Humans analyze and plan initiatives Future: AI automatically executes improvements - Detect HEART metric deterioration - Automatically select optimal improvement initiatives - Automatically execute and evaluate A/B tests - Automatically deploy winning patterns
Ecosystem HEART: Current: Single product measurement Future: Optimization across product portfolio - HEART coordination across all Google services - Cross-product experience measurement - Ecosystem-wide value maximization
Predicted New Blue Ocean Areas: - Wellbeing and mental health markets - Aging and senior-focused technology - Smart city and urban solutions - Frontier markets like space, ocean, polar regions - Biotechnology and life sciences
Conclusion - Investigation Summary
Final Investigator Report:
The HEART Framework is a "revolutionary measurement system that quantifies and improves user experience across 5 dimensions." This theory, published by Google in 2010, functions as a powerful framework that converts previously difficult-to-measure concepts like "usability," "satisfaction," and "experience quality" into objective numerical metrics, enabling continuous, data-driven UX improvement.
Most impressive in this investigation was the power of measuring from five different perspectives: Happiness, Engagement, Adoption, Retention, and Task Success. Balance, trade-offs, and early warning signals invisible with a single metric (e.g., revenue) become clearly visible through 5-dimensional measurement.
The systematicity of the Goals-Signals-Metrics 3-layer structure was also an important discovery. By converting the vague goal of "want to increase satisfaction" into the signal "users recommend to friends" and the concrete metric "NPS 50 or higher," a measurable and actionable improvement cycle is established.
Success stories from world-class products like Google Search, YouTube, and Slack clearly prove HEART's practicality and effectiveness. Through continuous HEART measurement, analysis, and improvement, sustained user experience enhancement and accompanying business growth are realized.
Integration possibilities with other business frameworks were also confirmed. HEART functions as a foundation that dramatically improves measurement accuracy in other methods, such as refining the Measure phase of MVP, effect measurement in Agile Development sprint reviews, and concrete KR setting in OKR.
The 6-month practical case study with a SaaS product also validates the theory's effectiveness. Dramatic improvements of NPS +69%, Retention +73%, and MRR growth rate +125% before and after HEART introduction prove that proper measurement generates proper improvement.
However, the risk of falling into "measurement for measurement's sake" also emerged as an important warning. A "measurement bubble" state where collecting numbers becomes the goal without leading to actual user value creation undermines HEART's essential value.
Attention to qualitative aspects not captured by quantitative metrics alone was also recognized as a necessary limitation. Insights not reflected in numbers must be supplemented by combining with user interviews, observation, and qualitative research.
The importance of segment analysis was also confirmed as an often-overlooked success factor. Overall averages alone hide true challenges as new user churn and veteran user high engagement cancel each other out. Detailed segment-specific analysis is essential.
Future evolution possibilities through integration with AI and machine learning were also confirmed. A future is visible where AI automatically extracts insights from HEART data and suggests improvement initiatives, such as retention prediction, automatic segment discovery, and optimization recommendation engines.
The necessity of organizational culture transformation was also recognized as an important implementation condition. Without a data-driven culture, experimentation mindset, and continuous improvement orientation, HEART ends as merely a list of numbers.
The most important discovery is that HEART functions beyond a mere "measurement method" as a "system that cultivates user-centric organizational culture." Through regular HEART measurement, review, and improvement cycles, a culture naturally forms where the entire organization prioritizes user experience.
In today's era of increasing uncertainty, intensifying competition, and rising user expectations, subjective evaluation of "somehow easy to use" is insufficient. The HEART Framework presents a new paradigm of "scientifically measuring and improving user experience," "making data-based decisions," and "realizing continuous value creation," providing a revolutionary approach to sustainable product growth.
Measurement Maxim: "What cannot be measured cannot be improved. However, what should be measured is not the numbers themselves, but the user happiness behind them."
【ROI Detective Agency Classified File Series X039 Complete】
Case Closed
🎖️ Top 3 Weekly Ranking of Classified Case Files
What is ROI
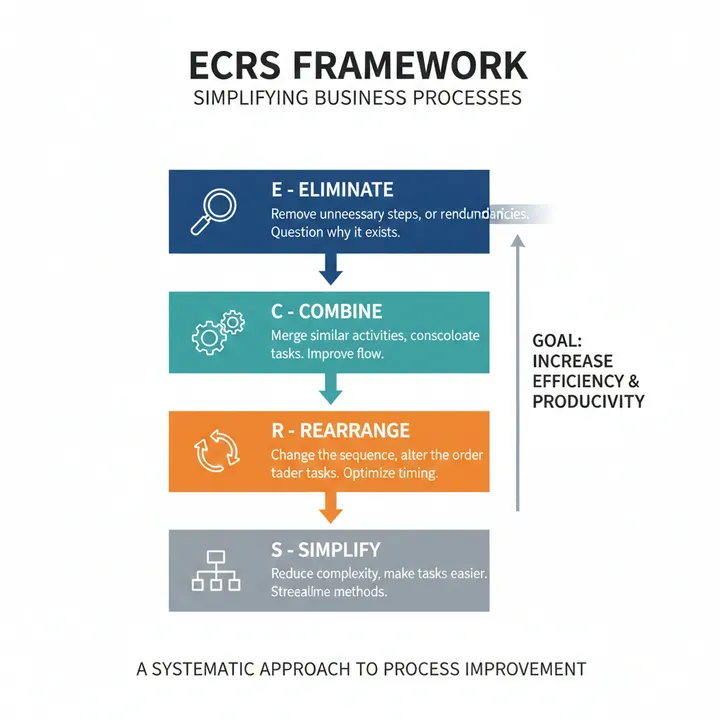
What is the ECRS Principle

What is the RICE Framework
Solve Your Business Challenges with Kindle Unlimited!
Access millions of books with unlimited reading.
Read the latest from ROI Detective Agency now!
*Free trial available for eligible customers only