ROI【🔏CLASSIFIED FILE】 No. X042 | What is the Kano Model
📅 2025-10-21
🕒 Reading time: 14 min
🏷️ KANO 🏷️ Kano Model 🏷️ Customer Satisfaction 🏷️ Learning 🏷️ 【🔏CLASSIFIED FILE】
- What is the Kano Model - Case Overview
- Basic Structure of the Kano Model - Evidence Analysis
- Implementation Procedure for the Kano Model - Investigation Methods
- The Power of the Kano Model - Cases Solved
- Limitations and Cautions of the Kano Model - Investigation Warnings
- Related Case Files
- Industry-Specific Kano Model Application Cases
- Investigation Summary - ROI Detective's Conclusion
Detective's Memo: In 1984, Professor Noriaki Kano of Tokyo University of Science published the revolutionary customer satisfaction theory known as the "Kano Model." While many believe that "fulfilling all customer requests increases satisfaction," the true identity is a "non-linear relationship where quality attributes fundamentally differ in their impact on satisfaction." Why does the beautiful design of an iPhone create delight, yet the inclusion of a charging cable is taken for granted? Why does hotel cleanliness cause fury when lacking, but receives no gratitude when perfect? And why does a feature that created amazement yesterday become "expected" today? Must-be Quality, One-dimensional Quality, Attractive Quality—the asymmetric impact these three elements have on customer satisfaction, and the laws governing how quality attributes migrate over time. Uncover the deep psychological structure that solves the mystery of "why improvement doesn't increase satisfaction."
What is the Kano Model - Case Overview
The Kano Model, formally known as the "Two-Factor Quality Model," is a customer satisfaction theory published by Professor Noriaki Kano of Tokyo University of Science in 1984. It is recognized among clients as a methodology that classifies quality attributes into five categories—Must-be Quality, One-dimensional Quality, Attractive Quality, Indifferent Quality, and Reverse Quality—and systematizes how the relationship between "fulfillment level (presence/degree of functionality)" and "satisfaction level (customer emotion)" varies non-linearly depending on the quality attribute. However, in actual business settings, it's often superficially understood as a "customer requirement list classification method," with the majority of companies failing to grasp the original strategic insights: the psychological structure where satisfaction and dissatisfaction are asymmetric, and the migration of quality attributes over time (Attractive → One-dimensional → Must-be).
Investigation Memo: The Kano Model is not merely a "quality classification" but a "diagnostic tool for visualizing the non-linearity of customer psychology." Why does "eliminating dissatisfaction ≠ creating satisfaction," and how should we incorporate the timeline where "yesterday's delight becomes tomorrow's expectation" into strategy? We must elucidate this structural theory of customer satisfaction that enables discovering "Attractive Quality" that generates promoters for NPS and prioritizing HEART Framework Happiness improvements.
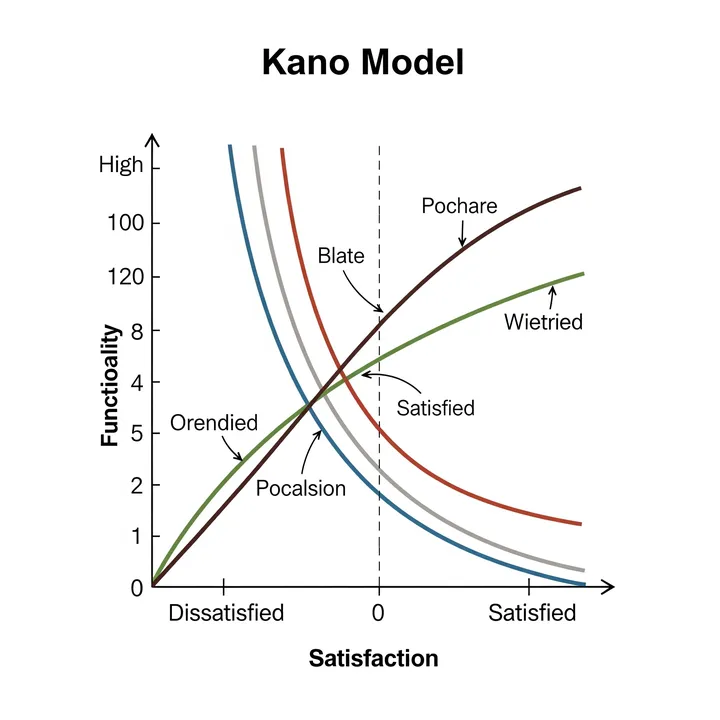
Basic Structure of the Kano Model - Evidence Analysis
Core Evidence: Non-linear Satisfaction Map Using Five Quality Attributes
The Kano Model Coordinate System
Horizontal Axis: Physical Fulfillment
Left end: Functionality completely absent / insufficient
Right end: Functionality fully present / sufficient
Vertical Axis: Customer Satisfaction
Top end: Highly satisfied (delight, excitement)
Center: Neutral
Bottom end: Highly dissatisfied (anger, disappointment)
Within this two-dimensional space, five distinct curves are drawn.
1. Must-be Quality (Basic Quality)
Definition: Expected elements; absence causes fury
Characteristic Curve Shape:
Low fulfillment → Satisfaction sharply decreases (high dissatisfaction)
High fulfillment → Satisfaction near zero (expected)

Meaning:
- When lacking: Rapid dissatisfaction occurs
- When fulfilled: No satisfaction generated (it's expected)
- Asymmetry is most pronounced
Concrete Examples:
Smartphone: - Phone functionality works → Expected (satisfaction ±0) - Phone functionality doesn't work → Fury (satisfaction -10)
Restaurant: - Clean dishes → Expected - Dirty dishes → Immediate complaint, never returning
Hotel: - Clean room → Expected - Unclean room → Fury, refund demanded
Web Service: - Site loads → Expected - Site doesn't load → Immediate abandonment
Business Impact:
Investment Effectiveness:
- Eliminating deficiency: Essential (prevents dissatisfaction explosion)
- Over-investment: Meaningless (satisfaction doesn't increase)

Strategic Position:
- Doesn't create competitive advantage
- However, deficiency is fatal
- "Minimum clearance" is the correct approach
Critical Insight: Over-investing in Must-be Quality wastes resources. The "world's cleanest hotel" cannot charge higher rates.
2. One-dimensional Quality (Performance Quality)
Definition: Elements where fulfillment and satisfaction are proportional
Characteristic Curve Shape:
Low fulfillment → Low satisfaction
High fulfillment → High satisfaction

Meaning:
- Linear relationship (proportional)
- More improvement = more satisfaction
- More deficiency = proportionally more dissatisfaction
Concrete Examples:
Smartphone: - Battery life - 1 hour → Dissatisfied - 1 day → Acceptable - 3 days → Satisfied - 1 week → Highly satisfied
Restaurant: - Food deliciousness - Bad → Dissatisfied - Average → Neutral - Delicious → Satisfied - Exquisite → Highly satisfied
Hotel: - Room size - 10㎡ → Small, dissatisfied - 20㎡ → Normal - 40㎡ → Spacious, satisfied - 100㎡ → Very satisfied
Web Service: - Loading speed - 10 seconds → Slow, frustrating - 3 seconds → Normal - 1 second → Fast, comfortable - 0.3 seconds → Very comfortable
Business Impact:
Investment Effectiveness:
- Improvement directly increases satisfaction
- Main battleground for competitive comparison
- Balance between cost and satisfaction is crucial

Strategic Position:
- Can be source of competitive advantage
- However, investment costs are also high
- "How far to go" judgment is key
Competitive Strategy: One-dimensional Quality is easily compared with competitors. "Faster, larger, more than competitors" becomes direct value.
3. Attractive Quality (Excitement Quality)
Definition: Elements that create delight when present, but cause no dissatisfaction when absent
Characteristic Curve Shape:
Low fulfillment (zero) → Satisfaction ±0 (no dissatisfaction)
High fulfillment → Satisfaction rapidly rises (delight, surprise)

Meaning:
- Reverse pattern of Must-be Quality
- When fulfilled: Great joy
- When lacking: No dissatisfaction (not expected)
Concrete Examples:
Smartphone: - Original iPhone's inertial scrolling → Delight (2007) - Android's back button → Wasn't missed but convenient - Face ID → Unexpected comfort
Restaurant: - Birthday surprise dessert → Delight - Chef's visit to explain dishes → Pleasant surprise - Special consideration for children → Gratitude
Hotel: - Welcome drink → Pleasant - Pillow menu selection → Unexpected service - Weather forecast note at checkout → Moved by thoughtfulness
Web Service: - Gmail's automatic categorization (2004) → Revolutionary - Spotify's Discover Weekly → Delightful - Notion's block-based editing → New experience
Business Impact:
Investment Effectiveness:
- Can generate high satisfaction even with low cost
- Source of competitive advantage
- Primary driver of word-of-mouth and NPS improvement

Strategic Position:
- Key to innovation
- Brand differentiation
- Creates [NPS](/behind_case_files/articles/X040_NPS) promoters (9-10 score)
Critical Insight: Attractive Quality is the hypothesis to validate with MVP. "Latent needs users haven't recognized" are hidden here.
4. Indifferent Quality
Definition: Elements that don't affect satisfaction whether present or absent
Curve Shape:
Low fulfillment → Satisfaction ±0
High fulfillment → Satisfaction ±0
(Consistently flat line near horizontal axis)
Concrete Examples:
Smartphone: - Thickness of instruction manual (nobody reads it) - Box design (discarded after opening) - Font of serial number
Restaurant: - Menu paper quality (if food is good) - Color of staff uniforms (if clean)
Hotel: - Number of facility information pamphlets - Room number font
Business Impact:
Investment Effectiveness: Zero
Strategic Position: Cost reduction target

Important Judgment:
By questioning "Is this Indifferent Quality?"
unnecessary investment can be eliminated
5. Reverse Quality
Definition: Elements that cause dissatisfaction when present, satisfaction when absent
Curve Shape:
Low fulfillment → High satisfaction
High fulfillment → Low satisfaction
(Downward sloping curve)
Concrete Examples:
Smartphone: - Excessive notifications → Annoying, intrusive - Undeletable pre-installed apps → Dissatisfaction
Restaurant: - Overly attentive service (too much talking) → Uncomfortable - Excessive portions (can't finish) → Guilt
Web Service: - Excessive tutorials → Let me use it already - Forced account creation → Bothersome
Business Impact:
Important Warning:
"Well-intentioned" efforts backfire
Attention to differences by customer segment and culture
Temporal Migration Law of Quality Attributes
Critical Discovery: Quality attributes migrate over time
Attractive Quality → One-dimensional Quality → Must-be Quality

Typical Migration Pattern:
1. Launch phase: Attractive Quality (delight, differentiation)
2. Growth phase: One-dimensional Quality (competitive element)
3. Maturity phase: Must-be Quality (expected)
Case Example: Smartphone Touchscreen
2007 (iPhone launch):
- Attractive Quality
- "You can operate by touching the screen!" → Delight
- Source of competitive advantage

Around 2010:
- One-dimensional Quality
- Touch response speed becomes competitive element
- Competition for "smoother, more accurate"

2015 onwards:
- Must-be Quality
- Smartphone without touch is unacceptable
- Presence doesn't increase satisfaction
Strategic Implications:
Trap of Past Success:
Attractive Quality "that brought success"
has now transformed into Must-be Quality

Need for Continuous Innovation:
Must constantly seek new Attractive Quality
Evidence Analysis: The innovation of the Kano Model lies in visualizing the asymmetry of customer psychology—"the relationship between fulfillment and satisfaction is not linear"—and enabling scientific prioritization of quality improvements.
Implementation Procedure for the Kano Model - Investigation Methods
Investigation Discovery 1: Quality Attribute Classification Using the Kano Questionnaire Method
Step 1: Design Pairs of Functional and Dysfunctional Questions
Kano Model's Unique Questioning Method:
Prepare two questions for each feature:
Functional Question: "How would you feel if this feature were present?"
Dysfunctional Question: "How would you feel if this feature were absent?"

Response Options (5-point scale):
1. I like it (Like)
2. I expect it (Expect)
3. I am neutral (Neutral)
4. I can tolerate it (Tolerate)
5. I dislike it (Dislike)
Example: Smartphone Battery Lasting 3 Days
Functional Question:
"How would you feel if the battery lasted 3 days?"
□ I like it
□ I expect it
□ I am neutral
□ I can tolerate it
□ I dislike it

Dysfunctional Question:
"How would you feel if the battery only lasted 1 day?"
□ I like it
□ I expect it
□ I am neutral
□ I can tolerate it
□ I dislike it
Step 2: Classification Based on Response Combinations
Kano Evaluation Table:
                    Dysfunctional Question Response
                  Like  Expect Neutral Tolerate Dislike
Functional  Like    Q     A      A       A        O
Question    Expect  R     I      I       I        M
Response    Neutral R     I      I       I        M
            Tolerate R    I      I       I        M
            Dislike  R     R      R       R        Q

Legend:
A = Attractive Quality
O = One-dimensional Quality
M = Must-be Quality
I = Indifferent Quality
R = Reverse Quality
Q = Questionable (contradictory response)
Classification Logic:
Attractive Quality (A):
- Functional: Like
- Dysfunctional: Tolerate/Neutral
→ Happy if present, but acceptable if absent

One-dimensional Quality (O):
- Functional: Like
- Dysfunctional: Dislike
→ Satisfied if present, dissatisfied if absent (proportional)

Must-be Quality (M):
- Functional: Expect/Neutral
- Dysfunctional: Dislike
→ Expected if present, fury if absent

Indifferent Quality (I):
- Functional: Neutral
- Dysfunctional: Neutral
→ No impact either way

Reverse Quality (R):
- Functional: Dislike
- Dysfunctional: Like
→ Better without it
Step 3: Aggregation and Strategic Prioritization
Aggregation Method:
Example: Survey of 100 people

Feature X "Automatic Backup":
- Attractive Quality: 60 people
- One-dimensional Quality: 30 people
- Must-be Quality: 5 people
- Indifferent Quality: 5 people

→ Most frequent category: Attractive Quality (60%)
→ Classification: A (Attractive)
Better-Worse Analysis for Prioritization:
Better Coefficient (contribution to satisfaction increase):
= (A + O) / (A + O + M + I)

Worse Coefficient (contribution to dissatisfaction):
= -1 × (O + M) / (A + O + M + I)

Automatic Backup Example:
Better = (60 + 30) / (60 + 30 + 5 + 5) = 0.90
Worse = -1 × (30 + 5) / 100 = -0.35

Interpretation:
- Better 0.90: Implementation significantly increases satisfaction
- Worse -0.35: Non-implementation causes little dissatisfaction
→ Priority: High (typical Attractive Quality)
Investigation Discovery 2: Apple's Utilization of the Kano Model
Case Evidence (Strategic Decision-Making in iPhone Development):
Phase 1: Original iPhone Development in 2007 - Quality Attribute Classification
Recognized as Must-be Quality:
- Phone functionality
- SMS messaging
- Contact list
→ Deficiency unacceptable as minimum requirement
→ No over-investment
Recognized as One-dimensional Quality:
- Screen size and resolution
- Battery life
- Processing speed
→ Comparison points with competitors
→ Balanced investment
Concentrated Investment in Attractive Quality:
Discovered Attractive Quality:
1. Multi-touch screen
   - Previous: Stylus pen required
   - iPhone: Intuitive operation with fingers
   - Delightful new experience

2. Inertial scrolling
   - Reproduction of physical "sliding"
   - Screen moves as if it were a physical object
   - "Magical" operational feel

3. Pinch-to-zoom
   - Intuitive operation of photos and maps
   - Completely new interaction
   - Patented technology competitors couldn't copy

Strategic Decision:
- Concentrate development resources on these three
- Prioritize "experience" over "phone"
- Aim for revolution, not improvement of existing phones
Results:
2007 Launch:
- Media: "Revolutionary device"
- Customers: "Never-before-seen experience"
- [NPS](/behind_case_files/articles/X040_NPS): Mass generation of promoters (9-10 score)

Attractive Quality generated word-of-mouth and enthusiasm
Achieved 6 million units sold in first year
Phase 2: Post-2010 - Responding to Quality Attribute Migration
Detecting Migration of Attractive Quality:
2007 Attractive Quality:
→ Migrated to One-dimensional Quality by 2010
→ Competitors implemented similar features

Apple's Response:
"Always seek new Attractive Quality"

New Attractive Quality:
- Retina Display (2010)
- Siri (2011)
- Touch ID (2013)
- Face ID (2017)

Strategy:
Add at least one new Attractive Quality annually
→ Continuous provision of delightful experiences
Field Lessons:
Kano Model looks not only at "now" but at "future":
1. Identify current Attractive Quality
2. Predict speed of migration to One-dimensional → Must-be
3. Develop next Attractive Quality in advance
4. Deliver next delight before competitors catch up

This is the secret of Apple's "always one step ahead"
The Power of the Kano Model - Cases Solved
Power 1: Optimal Resource Allocation with Limited Resources
Traditional Pitfall:
Attempting to improve entire "customer request list"
→ Resource dispersion
→ Everything half-baked
→ No satisfaction improvement
After Applying Kano Model:
1. Must-be Quality: Minimum clearance (no over-investment)
2. One-dimensional Quality: Necessary level for competitive comparison
3. Attractive Quality: Concentrated investment (source of differentiation)
4. Indifferent Quality: Reduction or elimination

→ Investment with contrast
→ Creation of delightful experiences
→ Satisfaction and [NPS](/behind_case_files/articles/X040_NPS) improvement
Power 2: Solving the Mystery of "Improvement Doesn't Increase Satisfaction"
Common Case:
Hotel Manager:
"We thoroughly enhanced cleanliness, but satisfaction didn't increase..."

Cause (revealed by Kano Model):
Cleanliness = Must-be Quality
→ Improvement doesn't increase satisfaction
→ Only causes fury when lacking

Solution:
Maintain Must-be Quality at minimum level
Shift investment to Attractive Quality
(Example: Welcome drinks, surprise services)
Power 3: Competitive Advantage Strategy on the Timeline
Predicting Quality Attribute Migration:
This year's Attractive Quality
→ Becomes One-dimensional Quality in 3 years
→ Becomes Must-be Quality in 5 years

Strategic Response:
- Short-term advantage with current Attractive Quality
- Parallel development of next Attractive Quality
- Establish continuous innovation cycle
Limitations and Cautions of the Kano Model - Investigation Warnings
Warning 1: Differences by Customer Segment
Same feature has different classifications by segment:
Feature: Advanced customization functionality

Power users: Attractive Quality (delight)
General users: Indifferent Quality (don't use it)
Beginners: Reverse Quality (confusing complexity)

→ Segment-specific surveys essential
Warning 2: Cultural and Regional Differences
Example: Frequency of server attention at restaurants

Japan: Reserved = Must-be Quality
       Frequent = Reverse Quality (annoying)

America: Frequent = Must-be Quality
         Reserved = Dissatisfaction (poor service)

→ Regional surveys necessary for global expansion
Warning 3: Survey Frequency
Quality attributes migrate
→ One survey is not the end
→ Regular re-surveys (1-2 times/year) ideal

Specifically:
- Technology industry: Fast migration (annually)
- Traditional industries: Slow migration (every 2-3 years)
Warning 4: Balance with Implementation Costs
Just because it's Attractive Quality
doesn't mean implementation cost is justified

Judgment Criteria:
Better Coefficient × Expected Revenue Increase > Implementation Cost
→ Select initiatives where this inequality holds
Related Case Files
Recommended Concurrent Investigation: - NPS - Promoter creation from Attractive Quality - HEART Framework - Integration with Happiness measurement - MVP - Validation of Attractive Quality hypotheses - Agile Development - Continuous quality attribute updates
Industry-Specific Kano Model Application Cases
SaaS Industry (Slack):
Must-be Quality: Send/receive messages, search
One-dimensional Quality: Sync speed, notification customization
Attractive Quality: Emoji reactions, thread function (initially)
→ Attractive Quality created differentiation and rapid growth
Automotive Industry (Tesla):
Must-be Quality: Drive, turn, stop
One-dimensional Quality: Range, acceleration
Attractive Quality: OTA updates, Autopilot (initially)
→ Revolution through Attractive Quality of software updates
Hotel Industry (Hoshino Resorts):
Must-be Quality: Cleanliness, basic amenities
One-dimensional Quality: Room size, meal quality
Attractive Quality: Regional cultural experiences, staff "omotenashi"
→ High value-added through Japanese Attractive Quality
Investigation Summary - ROI Detective's Conclusion
The essence of the Kano Model lies in visualizing the non-linearity that "not all improvements equally increase satisfaction." By avoiding over-investment in Must-be Quality and concentrating resources on Attractive Quality, maximum delight can be generated with limited budgets. Even more important is the dynamic perspective that quality attributes migrate over time. Today's delight becomes tomorrow's expectation—only organizations that understand this law and continuously seek new Attractive Quality can build sustainable competitive advantage. Customer satisfaction is not simple addition but strategic multiplication. When teaching "true customer needs" in sales training sessions, understanding this asymmetry and timeline enables essential value propositions that transcend superficial requirement gathering. The case always lurks—between customer expectations and reality.
【🔏CLASSIFIED FILE DESIGNATION】 This file contains classified information regarding the non-linear structure of customer satisfaction. Quality improvement without appropriate strategic judgment invites waste of resources. Handle with care. ```
📚 関連書籍
🎖️ Top 3 Weekly Ranking of Case Files

'QuantumGrocers' Lost Customer Data'

AeroSpray's Vanishing Sales Force'

'GlobalSoft's Drowning Inquiry Response'
Solve Your Business Challenges with Kindle Unlimited!
Access millions of books with unlimited reading.
Read the latest from ROI Detective Agency now!
*Free trial available for eligible customers only