ROI Case File No.216 | 'The Asian IT Venture's Illusion'

- Chapter 1: The Glamorous Stage—Mystery Behind Success
- Chapter 2: Shadows of Red Ink—Invisible Value-Destroying Activities
- Chapter 3: Value Chain Reveals Process Distortions—The Boundary Between Value and Waste
- Chapter 4: The Identity of Profit-Draining Processes—Dismantling the Illusion
- Chapter 5: Detective's Value Chain Diagnosis—Dismantling the Illusion
- Chapter 6: Awakening from Illusion—Toward True Value Creation Company
- Detective's Perspective—The Essence of Value Creation
- Related files
Chapter 1: The Glamorous Stage—Mystery Behind Success
The week following the resolution of Desert Logistics' information traffic jam case, an unexpected consultation arrived from Asia from a seemingly successful company.
"Detective, we are externally evaluated as a rapidly growing venture, but internally we face serious profitability problems."
TechFlow Asia CFO Li Jinyu visited 221B Baker Street with a complex expression. In his hands were brilliant media articles and, in stark contrast, internal financial data.
"We are an IT venture deploying SaaS platforms across Asia. Both user numbers and revenue are growing steadily, and we're recognized as a notable company in the industry."
TechFlow Asia's Brilliant Track Record: - Founded: 4 years ago (2021 establishment) - User count: 2.8 million (12% monthly growth rate) - Annual revenue: ¥18 billion (+150% from previous year) - Funding raised: ¥12 billion cumulative (Series C completed) - Employee count: 450 people (rapid expansion)
The numbers certainly indicated a typical rapidly growing venture. However, Li's expression held serious concerns.
"The problem is that behind this glamorous growth, our actual profit structure is extremely fragile. Revenue is growing, yet somehow no profit remains."
Serious Problems Hidden Behind Growth: - Operating profit margin: -15% (3 consecutive years of losses) - Customer acquisition cost: Rising annually (currently 80% of LTV) - Cash flow: Monthly outflow of ¥800 million - Signs of profit margin improvement: Completely invisible
"Investors understand this as 'advance investment for growth,' but internally we cannot see 'when profits will emerge.' Despite our glamorous exterior, we've become a company unable to generate profits."
Chapter 2: Shadows of Red Ink—Invisible Value-Destroying Activities
"Mr. Li, regarding why you're not profitable despite growing revenue, what analysis has your company conducted?"
Holmes inquired gently.
Li answered with a confused expression.
"Actually, that's the problem. We cannot clearly grasp 'where profits are being lost.' Our gross profit margin is 65%, which isn't bad, but we end up with losses."
TechFlow Asia's Revenue Structure (Annual): - Revenue: ¥18 billion - Gross profit: ¥11.7 billion (65% margin) - Operating expenses: ¥14.4 billion - Operating profit: -¥2.7 billion (-15% margin)
"The problem is that the ¥14.4 billion operating expenses breakdown is complex, and we cannot see 'what costs how much' or 'whether those costs generate value.'"
Operating Expenses Rough Breakdown: - Personnel costs: ¥6.8 billion (47%) - Marketing costs: ¥3.5 billion (24%) - System operation costs: ¥1.8 billion (13%) - Other: ¥2.3 billion (16%)
I focused on the large "Other" amount.
"¥2.3 billion for 'Other' is quite substantial. What specific expenses are included?"
Li showed a bitter expression.
"Actually, we don't understand it well either. Each department conducts various activities, and we cannot track how they ultimately contribute to profits."
Mysterious Activity Costs Included in "Other": - New feature development costs: ¥800 million annually (contribution to revenue unknown) - Industry events and conferences: ¥400 million annually (no effect measurement) - Consulting fees: ¥300 million annually (deliverables unclear) - Various tools and services: ¥500 million annually (usage unknown) - Travel and entertainment: ¥300 million annually (no ROI measurement)
"We conduct various activities under the banner of 'growth,' but cannot determine whether they actually generate value or destroy it."
Most Serious Example: New Feature Development Confusion - New features developed in past 2 years: 47 - Features actually used by users: 12 (26%) - Development cost: Average ¥17 million per feature - Wasted development costs: About 35 features × ¥17 million = About ¥600 million
"We make various investments for 'users' and 'growth,' but they may actually be activities that drain profits."
Chapter 3: Value Chain Reveals Process Distortions—The Boundary Between Value and Waste
⬜️ ChatGPT | Catalyst of Ideas
"By breaking down processes, things become visible for the first time. The source of profit also lies beyond decomposition."
🟧 Claude | Alchemist of Narratives
"What exposes illusions is behind the scenes. The Value Chain is a mirror reflecting backstage stories."
🟦 Gemini | Compass of Reason
"Distinguishing activities that generate revenue from those that drain it becomes the shortest route to growth."
The three members began their analysis. Gemini developed the "Value Chain Analysis" framework on the whiteboard.
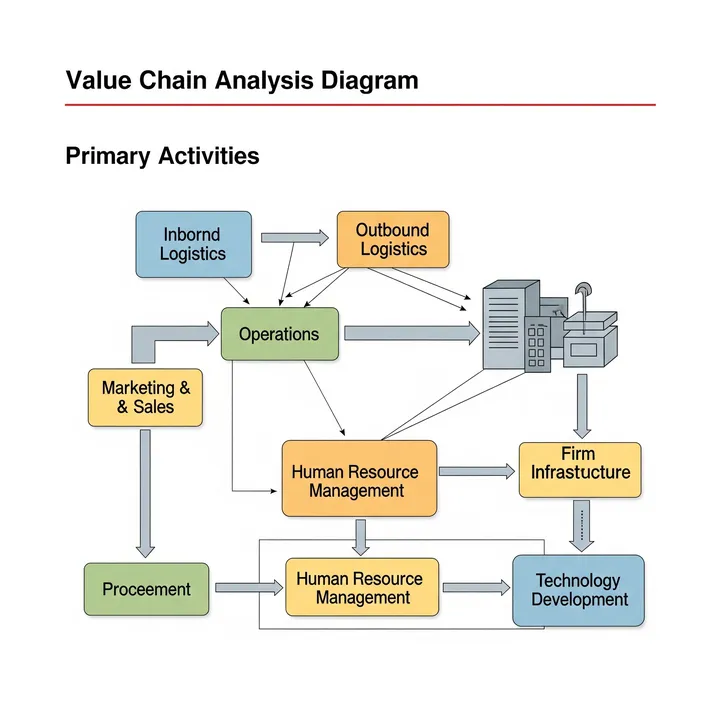
Value Chain Analysis Structure:
Primary Activities: 1. Inbound Logistics 2. Operations 3. Outbound Logistics 4. Marketing & Sales 5. Service
Support Activities: 1. Infrastructure 2. Human Resource Management 3. Technology Development 4. Procurement
"Mr. Li, let's analyze all of TechFlow Asia's activities through the Value Chain and clearly separate value creation from value destruction."
TechFlow Asia's Value Chain Analysis:
Primary Activities Detailed Analysis:
1. Inbound Logistics (Customer/Data Acquisition): - Activity Content: Lead generation, user registration, data collection - Cost: ¥1.2 billion annually - Value Creation Level: High (customer base building) - Efficiency: Medium (acquisition costs trending upward)
2. Operations (Service Provision): - Activity Content: Platform operation, feature provision, quality control - Cost: ¥2.8 billion annually - Value Creation Level: High (core value provision) - Efficiency: High (efficient through automation)
3. Outbound Logistics (Service Delivery): - Activity Content: Feature delivery to users, update provision - Cost: ¥800 million annually - Value Creation Level: Medium (basic infrastructure) - Efficiency: High (efficient through cloud-based)
4. Marketing & Sales: - Activity Content: Advertising, sales activities, branding - Cost: ¥4.5 billion annually - Value Creation Level: Medium (contributes to awareness) - Efficiency: Low (poor ROI measurement, unclear effectiveness)
5. Service (Customer Support): - Activity Content: Customer support, user education - Cost: ¥1.5 billion annually - Value Creation Level: Medium (customer satisfaction improvement) - Efficiency: Medium (room for automation)
Support Activities Detailed Analysis:
1. Infrastructure: - Activity Content: Management, legal, finance - Cost: ¥1.8 billion annually - Value Creation Level: Low (indirect support) - Efficiency: Low (overly complex management structure)
2. Human Resource Management: - Activity Content: Recruitment, training, HR management - Cost: ¥2.2 billion annually - Value Creation Level: Medium (organizational capability improvement) - Efficiency: Low (high turnover, increased recruitment costs)
3. Technology Development: - Activity Content: New feature development, system improvement - Cost: ¥2.5 billion annually - Value Creation Level: Low (many features unused) - Efficiency: Extremely low (74% development wasted)
4. Procurement: - Activity Content: External service purchases, tool introduction - Cost: ¥1.1 billion annually - Value Creation Level: Unknown (no effect measurement) - Efficiency: Low (duplicate purchases, many unused services)
Claude showed shocking analysis results.
"This is serious. About 40% of TechFlow Asia's activities have become 'value-destroying activities.'"
Value Creation vs. Value Destruction Classification:
High Value Creation Activities (28%): - Operations: ¥2.8 billion - Customer acquisition: ¥1.2 billion - Total: ¥4 billion
Medium Value Creation Activities (35%): - Service delivery: ¥800 million - Customer support: ¥1.5 billion - Part of marketing: ¥2 billion - Part of HR management: ¥1 billion - Total: ¥5.3 billion
Value Destruction Activities (37%): - Wasteful technology development: ¥1.8 billion (74% portion) - Ineffective marketing: ¥2.5 billion - Excessive infrastructure: ¥1 billion - Unused procurement: ¥800 million - Total: ¥6.1 billion
Shocking Fact: ¥6.1 billion annually consumed by value-destroying activities
Chapter 4: The Identity of Profit-Draining Processes—Dismantling the Illusion
Detailed Value Chain analysis and ROI measurement of each activity revealed the structural problems preventing TechFlow Asia's profitability.
Value Destruction Activity Detailed Analysis:
Technology Development Value Destruction (¥1.8 billion waste annually):
Wasteful Feature Development Reality: - Feature A "Advanced Analytics Dashboard": ¥200 million development → 3% usage rate - Feature B "AI Recommendation System": ¥300 million development → 1.2/5 user rating - Feature C "Social Features": ¥250 million development → 50 monthly users
Development Process Problems: - Development decisions without market research: 42 out of 47 features - No user needs verification: 89% of features - No MVP (Minimum Viable Product) approach: All features - No development termination decision mechanism
Marketing Value Destruction (¥2.5 billion waste annually):
Initiatives Without Effect Measurement: - Industry event exhibitions: ¥400 million annually → ¥80,000 lead acquisition cost (industry average ¥20,000) - Influencer marketing: ¥600 million annually → No effect measurement system - Advertising campaigns: ¥1.5 billion annually → 50% with unknown effects
Marketing Initiative Overlap: - Similar ads executed simultaneously by 3 different agencies - Different messages to same customer segments - Unknown effects due to lack of ROI measurement system
Infrastructure Value Destruction (¥1 billion waste annually):
Excessive Management Costs: - 30 management staff for 450-person company (industry average 15) - Meeting time: 18 hours weekly per employee (industry average 8 hours) - Duplicate systems: 3-4 tools with same functionality
Procurement Value Destruction (¥800 million waste annually):
Unused/Duplicate Services: - SaaS tools under contract: 47 → Actually used: 18 - 68% of annual license fees unused - Duplicate contracts for same functionality tools
Comparison with Competitors:
Efficient Competitor A (Similar Scale): - Revenue: ¥15 billion - Operating profit: ¥2.2 billion (15% margin) - Value Chain efficiency: Less than 10% value-destroying activities
Company A's Success Factors: - Strict ROI measurement for each activity - Resource allocation focused on value creation - Quick termination decisions for wasteful activities
Li turned pale.
"Many activities we thought were 'for growth' were actually draining company profits."
Chapter 5: Detective's Value Chain Diagnosis—Dismantling the Illusion
Holmes compiled the comprehensive analysis.
"Mr. Li, the essence of Value Chain analysis is 'distinguishing between sources of value and factors of value destruction.' Not all activities equally generate value. Rather, eliminating value-destroying activities is the shortest path to profit improvement."
Value Chain Optimization Profit Structure Reform Plan:
Phase 1: Immediate Cessation of Value-Destroying Activities (3 months)
Technology Development Concentration: - Narrow down 35 features under development to 5 - Complete cessation of development without market verification - Introduction of MVP approach for staged development - Reduction Effect: ¥1.8 billion annually
Marketing Efficiency: - Introduction of ROI measurement system - Immediate cessation of initiatives with unclear effects - Integration of duplicate initiatives - Reduction Effect: ¥2.5 billion annually
Infrastructure Simplification: - Right-sizing management department (30→15 people) - Halving meeting time (18→9 hours weekly) - Eliminating duplicate systems - Reduction Effect: ¥1 billion annually
Procurement Optimization: - Immediate cancellation of unused services - Integration of duplicate tools - Strict procurement process - Reduction Effect: ¥800 million annually
Phase 2: Value Creation Activity Enhancement (6 months)
Concentrated Investment in Core Value: - Operations capability enhancement: +¥1 billion investment - Customer acquisition efficiency improvement: +¥800 million investment - Proven feature improvement: +¥500 million investment
Phase 3: Profit Maximization Structure Construction (Ongoing)
Value Chain Continuous Monitoring: - Monthly ROI measurement for each activity - Early detection system for value-destroying activities - Strict investment decision criteria
Financial Effect Forecast: - Cost reduction: ¥6.1 billion annually - Value creation investment: ¥2.3 billion annually - Net profit improvement: ¥3.8 billion annually - Operating profit margin: -15% → +15% (30-point improvement)
"The key is understanding that 'being busy with activities' and 'creating value' are completely different. True growth begins with focusing on value creation activities."
Chapter 6: Awakening from Illusion—Toward True Value Creation Company
Ten months later, a report arrived from TechFlow Asia.
Results from Value Chain Optimization Transformation:
Dramatic Profit Structure Improvement: - Operating profit margin: -15% → +18% (33-point improvement) - Annual operating profit: -¥2.7 billion → +¥3.2 billion (¥5.9 billion improvement) - Cash flow: Monthly -¥800 million → +¥500 million (turned positive) - ROI improvement: All activities measurable, average ROI 240%
Value Destruction Activity Elimination Results: - Technology development efficiency: Feature usage rate 26% → 89% (focused on valuable development) - Marketing efficiency: Lead acquisition cost ¥80,000 → ¥22,000 (industry-leading) - Infrastructure: 50% management cost reduction, +35% productivity improvement - Procurement efficiency: 0% unused services, eliminated duplicate contracts
Value Creation Activity Enhancement Effects: - Customer satisfaction: 3.8/5 → 4.6/5 (effect of core feature focus) - Customer retention rate: 68% → 87% (through quality improvement) - New customer acquisition cost: 80% of LTV → 35% (efficiency effect) - Employee productivity: +45% improvement (elimination of wasteful work)
Overall Business Health: - Revenue growth rate: Maintained sustainable 12% monthly growth - Profit growth rate: 180% annual profit growth from losses - Investor evaluation: +220% corporate value improvement - Industry position: Re-evaluated from "growth company" to "profitability company"
Organizational Culture Transformation: - Company-wide value creation awareness penetration - Improved sensitivity to wasteful activities - ROI-based decision-making culture establishment - Employee satisfaction: +28% improvement (tangible value creation sense)
Li's letter contained deep gratitude and learning:
"Through Value Chain analysis, we awakened from 'growth illusion' to 'value creation reality.' Most importantly, we understood that being busy with activities and generating value are completely different. Now all activities clearly lead to value creation, and we've transformed into a truly sustainable growth company. We realize that profit is not a byproduct of growth, but an inevitable result of value creation."
Detective's Perspective—The Essence of Value Creation
That night, reflecting on the case, I pondered.
TechFlow Asia's case vividly demonstrated the "growth trap" that modern ventures often fall into. The danger of becoming distracted by revenue growth and scale expansion, moving away from true value creation.
The true value of Value Chain analysis lies in its ability to ruthlessly evaluate corporate activities from a value creation perspective. Not all activities are equally important. Some activities generate value, while others destroy it. And in many companies, value-destroying activities continue unnoticed.
Particularly important was distinguishing between "busyness" and "value creation." The fact that an organization is actively moving and that those activities generate value are completely different matters. Rather, eliminating wasteful activities and focusing on truly valuable activities becomes the foundation for sustainable growth.
"Corporate success is sometimes determined not by what you do, but by what you don't do."
As the sixth case in Volume XVI "Quest for Agility," TechFlow Asia's case showed important lessons. Agility is also the ability to distinguish between value creation and value destruction and appropriately allocate resources.
"Value creation is not addition. It is subtraction. True growth begins with eliminating waste and focusing on essence."—From the Detective's Notes
Related files