ROI Case File No.309 | 'Crescent Urban's Invisible Customer Behavior'
📅 2025-11-10 23:00
🕒 Reading time: 11 min
🏷️ RCD

- Chapter 1: The Labyrinth of 50,000—Data Exists, But Customers Remain Invisible
- Chapter 2: The Illusion of Records—Even With Data, It's Unusable
- Chapter 3: Integration as Foundation—Unifying 50,000 Members' Data
- Chapter 4: The Power of Circulation—RCD Cycle Transforms the Organization
- Chapter 5: Detective's Diagnosis—Measurement Creates Strategy
- Related Files
Chapter 1: The Labyrinth of 50,000—Data Exists, But Customers Remain Invisible
The week after the AutoForge Double Diamond case was solved, a new inquiry arrived from Tokyo regarding a real estate development company's point system overhaul. Volume 25, "The Pursuit of Certainty," Episode 309, tells the story of integrating scattered data and making campaign effectiveness measurable.
"Detective, we have 50,000 members. We issue point cards and award points when they visit. However, we have no idea who comes when or what they do. Even when we run campaigns, we can't measure their effectiveness."
Crescent Urban Developments Marketing Director, Mai Sato from Minato Ward, visited 221B Baker Street unable to hide her confusion. In her hands were sample membership cards and, in stark contrast, ten campaign reports marked "effectiveness unmeasurable."
"We develop real estate in Tokyo. Condominiums, commercial facilities, office buildings... We introduced a membership system five years ago. Points for model room visits, points for material requests, points for contracts. Currently, 50,000 people are registered members."
Crescent Urban's Data Chaos: - Established: 1995 (Real Estate Development) - Annual Revenue: 1.8 billion yen - Members: 50,000 (cumulative since 2020) - Point System: Card-based (introduced 2020) - Annual Visitors: 22,000 - Annual Contracts: 420 - Problem: Customer behavior data scattered, campaign effectiveness unmeasurable
There was deep anxiety in Sato's voice.
"The problem is that data is scattered everywhere. Point card data is in paper ledgers. Visit records are in Excel. Online reservations are in a separate system. Purchase history for merchandise (interior goods) is in yet another system. Everything is fragmented, and we can't see who did what in an integrated way."
Current Data Management Situation:
System 1: Point Card Ledger (Paper) - Management: Handwritten records at model room reception - Content: Member ID, visit date, points awarded - Problem: Not digitized, difficult to search
System 2: Visit Records (Excel) - Management: Individually managed at each model room (12 locations) - Content: Visitor name, visit date, property of interest - Problem: 12 Excel files not integrated
System 3: Online Reservation System - Management: Web reservation site - Content: Reservation date/time, reserver name, desired property - Problem: Not linked to visit records
System 4: EC Purchase History (Merchandise) - Management: EC site (interior goods sales) - Content: Purchased items, purchase amount, delivery address - Problem: Not linked to member ID
Result: Unable to see the complete customer picture
"Last month, we ran an 'Autumn Visit Campaign.' We gave an additional 1,000 points to visitors. We sent direct mail to all 50,000 members. But how many people actually visited because of this campaign? How many of them signed contracts? We don't know. The direct mail alone cost 2 million yen in postage. But did it have any effect...?"
Chapter 2: The Illusion of Records—Even With Data, It's Unusable
"Ms. Sato, how are campaign effects currently being measured?"
To my question, Sato replied:
"Honestly, we can't measure them. The number of visitors during the campaign period increased by 12% compared to the previous month. But we don't know if that was the effect of the campaign or seasonal factors. We can't distinguish who visited after seeing the direct mail from who visited for other reasons."
Current Measurement Method (Ambiguous): - Metric: "Number of visitors during campaign period" - Assumption: "If it increases, the campaign succeeded" - Problem: Causal relationship unclear
I explained the importance of data integration and measurement.
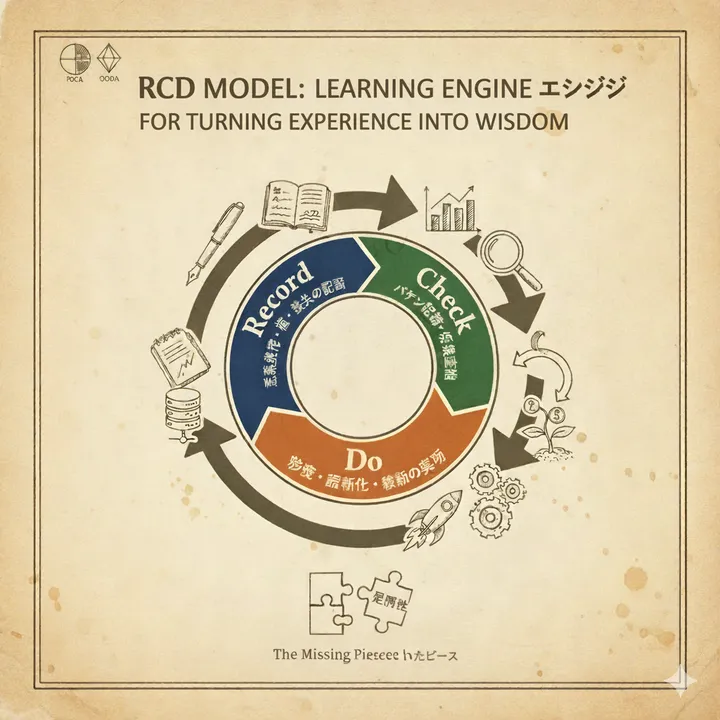
"Even if you have data, if it's not integrated, you can't see anything. RCD—Record, Check, Do. By cycling through these three steps, campaign ROI becomes measurable."
⬜️ ChatGPT | Catalyst of Concepts
"Don't just collect data. Integrate data. With RCD, circulate record, check, and execution"
🟧 Claude | Alchemist of Narratives
"Data is a stone. Only those who polish it, arrange it, and give it meaning obtain the jewel"
🟦 Gemini | Compass of Reason
"RCD is the technology of measurement. Capture facts through recording, learn through checking, improve through execution"
The three members began their analysis. Gemini displayed the "RCD Cycle Framework" on the whiteboard.
RCD's 3 Steps: 1. Record: Uniformly record all customer behavior 2. Check: Analyze data and measure campaign effectiveness 3. Do: Execute next campaign based on measurement results
"Ms. Sato, let's integrate Crescent Urban's membership data with RCD."
Chapter 3: Integration as Foundation—Unifying 50,000 Members' Data
Phase 1: Record—Building Data Integration Infrastructure (3 months)
First, we created an infrastructure to integrate scattered data.
Step 1: Unifying Member ID System (2 weeks)
Current Problems: - Point cards: Member numbers (handwritten, C0001~C50000) - Visit records: Name and phone number (no member ID) - Online reservations: Email address - EC purchases: Customer number (separate system, E0001~E8200)
Unification Policy: - Use "unified member ID" across all systems - Issue unified IDs to existing 50,000 members - Register new members with unified IDs
Unification Work: - Scan and OCR paper ledgers → Digitization - Matching by name, phone number, email address - Cleaning duplicate and missing data - Time required: Approximately 200 hours (5 part-time workers)
Step 2: Building Integrated Database (1.5 months)
System Introduced: - Cloud-based CRM (Customer Relationship Management) - Investment: Initial cost 1.8 million yen + 150,000 yen monthly
Integrated Data: - Member master: Unified ID, name, contact info, registration date - Visit history: Visit date/time, location, staff member, property of interest - Online behavior: Reservation date/time, pages viewed, dwell time - Purchase history: Purchased items, purchase amount, purchase date - Point history: Award date, points awarded, usage date, points used
Step 3: Event Design (2 weeks)
We designed a system to record all customer behavior as "events."
Event Types:
| Event Name | Trigger Timing | Recorded Content |
|---|---|---|
| Member Registration | Initial registration | Registration date, inflow route |
| Web Browsing | Property page view | View date/time, property ID, dwell time |
| Online Reservation | Reservation complete | Reservation date/time, property, desired date |
| Model Room Visit | Reception check-in | Visit date/time, property, number of companions |
| Material Request | Material download | Request date/time, material type |
| EC Purchase | Purchase complete | Purchase date/time, item, amount |
| Point Usage | Point redemption | Usage date/time, points used, exchanged item |
| Contract | Contract signed | Contract date, property, contract amount |
Recording Granularity: Record "when, who, what" for all events
Step 4: Data Integration Complete (1 month)
After three months, all data was consolidated into the integrated database.
Integrated Data Scale: - Members: 50,000 - Total Events: Approximately 420,000 (past 3 years) - Data Volume: Approximately 2.8GB
Visualization: - Dashboard construction - Display member-by-member behavioral history chronologically - Aggregate graphs by segment
Sato's eyes lit up.
"For the first time, I can see the complete customer picture. This member went from web reservation → visit → contract. This member only made EC purchases without visiting... Everything is connected."
Phase 2: Check—Data Analysis and KPI Measurement (2 months)
With integrated data, "checking" became possible for the first time.
Step 1: Re-analyzing Past Campaign Effects (2 weeks)
Using integrated data, we re-measured the effects of the past 10 campaigns.
Campaign Example: "Autumn Visit Campaign" (Previous month) - Measures: Direct mail to all 50,000 members, additional 1,000 points for visits - Cost: Direct mail postage 2 million yen + point cost equivalent 1.2 million yen = 3.2 million yen
Re-analysis Results:
Visitor Breakdown (1,200 people): - Members who visited after seeing direct mail: 180 (15%) - Members who visited without seeing direct mail: 1,020 (85%)
Breakdown of 180 Who Saw Direct Mail: - First visit: 45 (25%) - Return visit: 135 (75%)
Contract Breakdown (38 cases): - Members who saw direct mail: 5 (13%) - Members who didn't see direct mail: 33 (87%)
ROI Calculation: - Investment: 3.2 million yen - Contracts from members who saw direct mail: 5 - Average contract amount per case: 42 million yen - Revenue from members who saw direct mail: 210 million yen - Gross margin (average): 18% - Gross profit: 37.8 million yen - ROI: (37.8M - 3.2M) / 3.2M = 1,081% (10.8x)
But the Real Problem: - The 33 contracts without seeing direct mail (revenue 1.386 billion yen, gross profit 249 million yen) may not have needed the campaign - Was it necessary to send to all 50,000?
Sato was stunned.
"So of the direct mail sent to 50,000 people, only 180 actually had an effect...? For the remaining 49,820, it was wasted?"
Step 2: Segment-by-Segment Analysis (1 month)
We classified members using RFM analysis.
Segment Classification:
| Segment | Definition | Count | Percentage |
|---|---|---|---|
| VIP Customers | Contracted, continuous visits | 1,200 | 2.4% |
| Premium Prospects | Visited within 3 months, high interest | 4,800 | 9.6% |
| Promising Prospects | Visited within 6 months, medium interest | 8,500 | 17% |
| Low Interest | No visit for over 1 year, browsing only | 12,500 | 25% |
| Dormant | No contact for over 2 years | 23,000 | 46% |
Direct Mail Response Rate by Segment:
| Segment | DM Sent | Visits | Response Rate | Contracts | Contract Rate |
|---|---|---|---|---|---|
| VIP Customers | 1,200 | 42 | 3.5% | 2 | 0.17% |
| Premium Prospects | 4,800 | 95 | 1.98% | 3 | 0.06% |
| Promising Prospects | 8,500 | 43 | 0.51% | 0 | 0% |
| Low Interest | 12,500 | 0 | 0% | 0 | 0% |
| Dormant | 23,000 | 0 | 0% | 0 | 0% |
Discovery: - Only "VIP Customers" and "Premium Prospects" had effects - Low Interest and Dormant segments (total 35,500, 71%) had zero response - Wasted direct mail: 35,500 × 40 yen = 1.42 million yen
Step 3: KPI Design (2 weeks)
We designed KPIs to measure campaign effectiveness.
Key KPIs: 1. Segment Response Rate: Percentage who responded to direct mail 2. Visit Conversion Rate: Direct mail sent → visit conversion rate 3. Contract Conversion Rate: Visit → contract conversion rate 4. ROI: Profit relative to campaign investment 5. Member LTV (Lifetime Value): Lifetime value per member
KPI Dashboard: - Real-time updates - Display by segment and campaign
Phase 3: Do—Optimization Based on Measurement (Ongoing)
Based on insights from "checking," we executed the next campaign.
New Campaign: "Year-End Visit Campaign" (3 months later)
Before (Old Method): - Direct mail to all 50,000 members - Cost: 2 million yen
After (RCD Method): - VIP customers (1,200) receive direct mail + phone follow-up - Premium prospects (4,800) receive direct mail - Promising prospects (8,500) receive email (low cost) - Low interest and dormant (35,500) receive nothing
Investment: - Direct mail: 6,000 × 40 yen = 240,000 yen - Phone follow-up: 1,200 calls × 3 min × 1,500 yen/hour = 90,000 yen - Email: 8,500 × 0 yen = 0 yen - Total: 330,000 yen (16.5% of previous)
Results (3 weeks later):
Visitor Count: - VIP customers: 72 (6% response rate) - Premium prospects: 168 (3.5% response rate) - Promising prospects: 85 (1% response rate) - Total: 325 (1.8x the old method's 180)
Contract Count: - VIP customers: 4 - Premium prospects: 8 - Promising prospects: 1 - Total: 13 (2.6x the old method's 5)
ROI: - Investment: 330,000 yen - Revenue: 13 × 42M yen = 546M yen - Gross profit: 546M × 18% = 98.28M yen - ROI: (98.28M - 0.33M) / 0.33M = 29,677% (297x)
Sato was deeply moved.
"We reduced investment by 84% and increased results by 2.6x. This is the power of measurement."
Chapter 4: The Power of Circulation—RCD Cycle Transforms the Organization
After 6 Months of Continuous Improvement:
Crescent Urban embedded the RCD cycle into its organizational culture.
Record: - Automatically record data at all customer touchpoints - QR code scan at model room reception → Instantly reflected in CRM - Website browsing and app usage recorded in real-time
Check: - Weekly KPI reviews - Compare response rates by segment - Continuously run A/B tests (direct mail content, incentive types)
Do: - Prioritize investment in high-response segments - Decide to pause campaigns for low-response segments - Personalized delivery (send only property info of interest)
After 12 Months:
Marketing Efficiency: - Direct mail sent: 600,000/year → 96,000/year (84% reduction) - Postage cost: 24M yen/year → 3.84M yen/year (84% reduction) - Visitors: 22,000/year → 29,000/year (+32%) - Contracts: 420/year → 612/year (+46%)
ROI: - Marketing investment: 24M yen/year → 3.84M yen/year - Gross profit increase: 380M yen/year (192 additional contracts × 42M yen per contract × 18% margin) - ROI: (380M - 3.84M) / 3.84M = 9,792% (98x)
Organizational Change: - From "send to everyone" to "send to those who respond" - KPI dashboard becomes morning meeting topic - Campaign success/failure known immediately → faster decision-making
Sato's Reflection:
"Until we introduced RCD, we did marketing 'somehow.' We ran campaigns and assumed 'probably had an effect.'
But by cycling through record, check, and execution, everything became clear. What works and what doesn't. Who to send to and who not to send to.
Data isn't just stones. When polished, they become jewels."
Chapter 5: Detective's Diagnosis—Measurement Creates Strategy
That evening, I reflected on the essence of RCD.
Crescent Urban had membership data for 50,000 people. However, the data was scattered and not integrated. As a result, campaign effectiveness couldn't be measured, and they continued the inefficient strategy of "sending to everyone."
But by cycling through "record, check, execute" with RCD, everything changed. Data was integrated, effects were measured, and optimal campaigns were executed.
"Even with data, if you can't measure, you can't see anything. RCD transforms data into strategy."
The next case will also depict the moment when RCD generates results through measurement.
"Don't just collect data. Integrate data. Record, check, and execute. The RCD cycle creates measurable strategy"—From the Detective's Notes
Related Files
🎖️ Top 3 Weekly Ranking of Case Files

'PharmaLogistics' Invisible Customer'

'Bravura Retail's Paper Culture: A 2025 Relic'

'UrbanDesign's Blueprint Labyrinth'