ROI Case File No.321 | 'NexBridge's Invisible Goals'
📅 2025-11-16 23:00
🕒 Reading time: 10 min
🏷️ OKR

- Chapter 1: The Illusion of Goals—How To-Do Lists Stop Organizations
- Chapter 2: The Trap of Numbers—How Metrics Kill Purpose
- Chapter 3: Purpose as an Axis—How Words Align Organizations
- Chapter 4: Weekly as a Habit—The Moment Progress Becomes Transparent
- Chapter 5: The Power of Purpose—Organizational Change After 12 Months
- Chapter 6: The Detective's Diagnosis—Volume 27 "The Pursuit of Reproducibility" Opens
- Related Files
Chapter 1: The Illusion of Goals—How To-Do Lists Stop Organizations
The week after the Frontier Books JTBD case was solved, a consultation arrived from Tokyo regarding goal management at a mid-sized IT company. Episode 321, the opening of Volume 27 "The Pursuit of Reproducibility," tells the story of reconnecting fragmented goals with a single axis.
"Detective, our company is growing rapidly. Our staff has increased from 48 three years ago to 128 currently. However, as the organization has grown, each department has begun facing different directions. Sales pursues revenue targets, development tracks feature implementation counts, customer success measures response volumes... The numbers are being achieved, but we don't feel like the company as a whole is moving forward."
Kenta Hashimoto, Head of Corporate Planning at NexBridge Solutions, a Minato Ward native, visited 221B Baker Street unable to hide his confusion. In his hands were goal achievement reports from each department and, in stark contrast, management meeting minutes marked "directional misalignment."
"We develop and provide SaaS-based business management tools for small and medium enterprises in Tokyo. Seventh year since founding. Customer count has grown to 1,200 companies. However, interdepartmental coordination is lacking. Development cannot adequately support customers acquired by sales. Even when customer success gathers requests, they don't enter development's priority queue."
NexBridge's Goal Fragmentation: - Established: 2018 (SaaS business management tool) - Annual revenue: ¥1.8 billion (+42% YoY) - Staff: 128 (Sales 32, Development 48, CS 28, Management 20) - Customers: 1,200 companies - Customer satisfaction: 68% (industry average 82%) - Churn rate: 8% monthly (industry average 4%) - Problem: Each department has independent goals; company direction is not shared
Deep crisis filled Hashimoto's voice.
"The problem is that goal setting has become 'to-do lists.' Sales has '100 new contracts,' development has '20 new features implemented,' CS has '500 monthly inquiries handled'... Even achieving these goals doesn't improve customer satisfaction or reduce churn. Because each department only focuses on finishing their own work."
Typical Interdepartmental Fragmentation:
Sales Department Goal Achievement:
Sales Director: "We achieved this month's target of 100 new contracts again! Wonderful results!"
Management: "Well done. Then why is the churn rate 8%?"
Sales Director: "That's customer success's problem. We're bringing in contracts."
Development Department's Position:
Development Director: "We implemented 20 new features this quarter. Right on schedule."
Management: "However, the 'report function improvement' that customers request most hasn't been included yet. Why?"
Development Director: "Because it had low priority. We're achieving our implementation count targets."
Customer Success Department's Cry:
CS Director: "We receive 300 complaints monthly from customers saying 'it's hard to use.' But development won't respond. Sales only brings in contracts without follow-up afterward. Only we are caught in between."
Hashimoto sighed deeply.
"At meetings, each department reports. 'We achieved our goals.' But nothing has improved for the company as a whole. Customer satisfaction remains at 68%. Churn rate remains at 8%. Revenue is growing, but only because we're covering it with new acquisitions. At this rate, we'll eventually hit a limit."
Chapter 2: The Trap of Numbers—How Metrics Kill Purpose
"Mr. Hashimoto, how is the current goal-setting process determined?"
To my question, Hashimoto answered.
"At the beginning of the year, management decides 'this year's revenue target is ¥1.8 billion.' We allocate that to each department. Sales works backward: 'So how many new contracts do we need?' Development calculates: 'So how many features do we need to build?' CS sets: 'So how many inquiries do we need to handle?' And then each chases their own numbers."
Current Approach (Numerical Decomposition Type): - Revenue targets decomposed by department - Each department sets independent KPIs - Problem: Lack of interdepartmental coordination prevents overall optimization
I explained the importance of sharing purpose.
"Numbers are means. Not purpose. OKR—Objectives and Key Results. Define purpose in words, measure results in numbers. Don't get this order wrong. If everyone at NexBridge can share 'what we're working for,' actions will naturally align."
⬜️ ChatGPT | Concept Catalyst
"Don't list goals. Verbalize purpose. With OKR, everyone faces the same direction."
🟧 Claude | Story Alchemist
"Numbers follow afterward. First, decide where hearts should go. Purpose moves people."
🟦 Gemini | Compass of Reason
"OKR is a framework for focus. Show direction with Objective (purpose), measure progress with Key Results (outcome indicators)."
The three members began analysis. Gemini deployed the "OKR Framework" on the whiteboard.
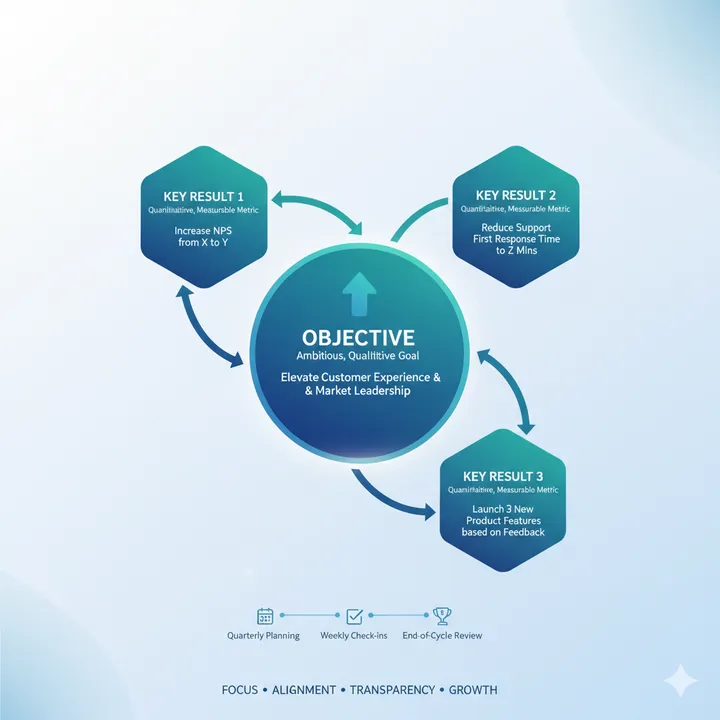
OKR Structure:
Objective (Purpose):
- Qualitative, ambitious, exciting goal
- Words all employees can understand

Key Results (Outcome Indicators):
- Quantitative, measurable, achievement determinable
- Usually 3-5 items
- 60-70% achievement rate considered "success" (ambitious goal setting)
"Mr. Hashimoto, let's create NexBridge's company-wide OKR together."
Chapter 3: Purpose as an Axis—How Words Align Organizations
Phase 1: Company-Wide Objective Development (2 weeks)
First, we gathered management and 20 department heads for a workshop.
Question: "What does NexBridge exist for? What do we want to provide to customers?"
Management's Responses: - "Provide business efficiency tools" - "Support DX for small and medium enterprises" - "Create easy-to-use systems"
Hashimoto's Point: "These are 'what we do (What).' 'Why we do it (Why)' is missing."
Follow-up Question: "Then, why do we provide business efficiency tools?"
Sales Director: "Because we want systems that don't steal customers' time. Current business management tools are too complex and time-consuming to use."
Development Director: "Because we want customers to be able to focus on the work they really want to do."
CS Director: "Because we want customers to genuinely think 'I'm glad I used this tool.'"
After discussion, the company-wide Objective was determined:
Company-Wide Objective (2025 Q1-Q4):
"Maximize customer success"
Simple, yet understandable to all employees. Sales, development, CS—all work toward this purpose.
Phase 2: Key Results Setting (1 week)
Next, we determined indicators to measure whether this purpose was achieved.
Key Results (Outcome Indicators):
KR1: Improve customer satisfaction from 68% → 90%
KR2: Reduce churn rate from monthly 8% → monthly 3%
KR3: Shorten average support inquiry response time from 48 hours → 12 hours
Hashimoto explained.
"Looking at these three indicators shows whether we're 'maximizing customer success.' Satisfaction rises, churn decreases, support becomes faster. If we achieve these, customers are succeeding."
Phase 3: Departmental OKR Development (2 weeks)
Based on the company-wide OKR, we determined how each department would contribute.
Sales Department OKR:
Objective: Increase contracts where customers succeed
KR1: Improve 3-month post-contract usage continuation rate to 80%
KR2: Improve initial onboarding completion rate to 95%
KR3: Acquire 10 monthly new contracts via customer referrals
Sales Director: "Previously, we only chased 'contract numbers.' But that's meaningless. Now we aim to 'have them continue using after contract.'"
Development Department OKR:
Objective: Deliver features customers want at maximum speed
KR1: Implement top 5 customer-requested features within the quarter
KR2: Achieve average user satisfaction of 4.5/5 or higher for new features
KR3: Keep system downtime due to failures under 1 hour monthly
Development Director: "Previously, we chased 'implementation numbers.' But they weren't features customers truly needed. Now, we prioritize customer voice."
CS Department OKR:
Objective: Resolve customer questions instantly
KR1: Shorten average inquiry response time to within 12 hours
KR2: Improve self-resolution rate (resolved via FAQ or help) to 60%
KR3: Improve support satisfaction to 4.8/5
CS Director: "Previously, we chased 'response volume.' But simply processing numbers doesn't satisfy customers. Now, we emphasize quality and speed."
Chapter 4: Weekly as a Habit—The Moment Progress Becomes Transparent
Phase 4: Weekly OKR Review Introduction (Ongoing)
Setting OKR isn't the end. We created a system to review weekly.
Every Friday 3:00 PM, Company-Wide OKR Review Meeting (30 minutes):
Agenda: 1. Company-wide Key Results progress confirmation 2. Each department's Key Results progress confirmation 3. Blocker (obstacle) sharing and solution discussion
Week 1 Review:
Company KR1: Customer satisfaction 68% → 90% - Current: 72% (+4%) - Measure: Strengthen onboarding for new customers
Company KR2: Churn rate monthly 8% → monthly 3% - Current: 7.2% (-0.8%) - Measure: Begin churn reason analysis
Company KR3: Support response time 48 hours → 12 hours - Current: 38 hours (-10 hours) - Measure: Improve self-resolution rate by enriching FAQ
Sales Department Report:
Sales Director: "For our KR1 '80% 3-month post-contract usage continuation rate,' we're currently at 68%. The problem is insufficient post-contract follow-up. We'll coordinate with CS to strengthen onboarding."
CS Director: "Understood. Please share the list of customers sales has contracted. We'll support initial setup."
→ Interdepartmental coordination naturally emerges
Development Department Report:
Development Director: "For our KR1 'top 5 customer-requested feature implementation,' we've completed 2 currently. However, we're stuck on the third 'report function improvement.' The specifications are complex, taking design time."
CS Director: "We've collected 20 specific customer requests. If we share those with development, wouldn't the specifications solidify?"
Development Director: "That would help! Please share immediately."
→ Information flow accelerates
Phase 5: Quarterly OKR Reset (3 months)
OKR resets quarterly, setting new Objectives.
End of Q1 (After 3 months):
Company-Wide KR Achievement Rate: - KR1: Customer satisfaction 72% → 85% (target 90%, achievement 94%) - KR2: Churn rate 7.2% → 4.5% (target 3%, achievement 75%) - KR3: Support response time 38 hours → 15 hours (target 12 hours, achievement 88%)
Overall Achievement Rate: 86%
Hashimoto: "While 60-70% OKR achievement is considered 'success,' we achieved 86%. Wonderful results. However, churn rate improvement is lagging. In Q2, we'll make this top priority."
Q2 Company-Wide Objective (New Setting):
"Become a service customers can't let go of"
Q2 Key Results:
KR1: Reduce churn rate from 4.5% → 2%
KR2: Improve monthly active user rate to 82% (customers continue using tool)
KR3: Improve NPS (Net Promoter Score) to +40
Chapter 5: The Power of Purpose—Organizational Change After 12 Months
Results After 12 Months:
Customer Metrics: - Customer satisfaction: 68% → 88% (+20 points) - Churn rate: monthly 8% → monthly 2.8% (65% reduction) - NPS: -5 → +38 (major improvement)
Business Results: - Annual revenue: ¥1.8 billion → ¥2.4 billion (+33%) - Customer count: 1,200 → 1,580 companies (+32%) - New contracts via customer referrals: 15 annually → 180 annually (+1100%)
Organizational Change:
Departmental Walls Disappeared:
Hashimoto: "Previously, sales, development, and CS chased separate goals. Now, everyone shares the common purpose of 'customer success.' In interdepartmental meetings, phrases like 'your work' and 'our work' disappeared. They changed to 'our work.'"
Employee Voices:
Sales Staff A: "Previously, I only chased 'contract numbers.' But I didn't care whether customers were satisfied after contract. Now, I check whether customers I contracted are still using after 3 months. I understand that's my result."
Development Engineer B: "Previously, only 'building features' was my job. But I didn't know who would use those features or why they were necessary. Now, I hear customer voices directly from CS. I build after understanding 'this feature will solve this customer problem.' So it's rewarding."
CS Staff C: "Previously, I was exhausted chasing 'response volume.' Now, 'response time reduction' and 'self-resolution rate improvement' are goals. I'm enriching FAQs, requesting UI improvements from development, creating systems where customers can resolve issues themselves. As a result, inquiry volume itself has decreased."
Hashimoto's Summary:
"Before introducing OKR, we had 'to-do lists,' not 'goals.' Each department only focused on finishing their own tasks.
By verbalizing 'purpose' through OKR, everyone began facing the same direction. We gained a single axis of 'maximizing customer success.'
And by reviewing weekly, progress became transparent. Everyone could see what's going well and where we're stuck.
OKR is not an evaluation system. It's a framework for focus. Everyone understands 'what's most important now' and spends time on it. I learned this is how to maximize organizational power."
Chapter 6: The Detective's Diagnosis—Volume 27 "The Pursuit of Reproducibility" Opens
That night, I reflected on the essence of OKR.
NexBridge was chasing numbers. However, numbers are means, not purpose.
By verbalizing purpose through OKR, the organization aligned. They gained the common language of "maximizing customer success." And by reviewing weekly, progress became transparent and interdepartmental coordination naturally emerged.
"When purpose becomes words, action accelerates. OKR connects fragmented organizations with a single axis."
Volume 27 "The Pursuit of Reproducibility" opens here.
The next case will also depict the moment when purpose transforms organizations.
"Don't list goals. Verbalize purpose. Objective (purpose) shows direction, Key Results (outcomes) measure progress. Design the moment when everyone faces the same direction."—From the detective's notes
Related Files
🎖️ Top 3 Weekly Ranking of Classified Case Files
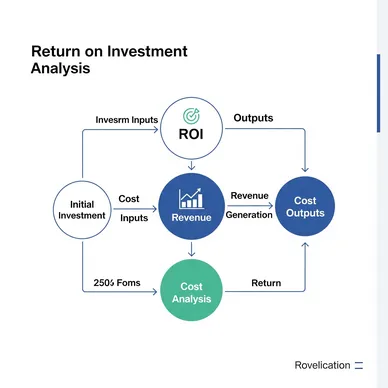
What is ROI
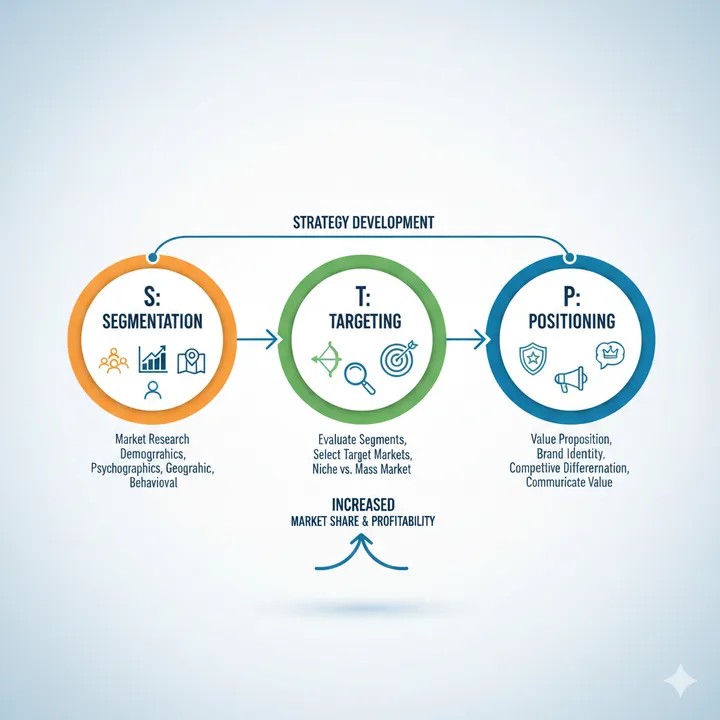
What is STP Analysis

What is the RICE Framework