ROI Case File No.330 | 'Fleming's Invisible Investment'
📅 2025-11-21 11:00
🕒 Reading time: 9 min
🏷️ ROI

- Chapter 1: Stagnation Through Obsolescence—10-Year-Old System Stops Operations
- Chapter 2: The Wall of Intuition—Can't Decide Without Numbers
- Chapter 3: Proof Through Visualization—Converting Work Hours to Amounts
- Chapter 4: Results After Implementation—12 Months Later
- Chapter 5: The Detective's Diagnosis—Volume 27 "The Pursuit of Reproducibility" Conclusion
- Related Files
Chapter 1: Stagnation Through Obsolescence—10-Year-Old System Stops Operations
The week after the ChronoAnalytics RCD case was solved, a consultation arrived from Tokyo regarding system replacement at an established trading company. Episode 330, the final story of Volume 27 "The Pursuit of Reproducibility," tells the story of quantifying investment value and deciding to buy the future.
"Detective, our sales management system was introduced 10 years ago. Orders, inventory, billing... all operations run on this system. However, obsolescence is severe. Slow processing, complex operations, can't centrally manage... We're considering replacement, but management can't decide. 'Is it really worth investing?'"
Kenta Fleming, Information Systems Director at Fleming Enterprises, a Nihonbashi native, visited 221B Baker Street unable to hide his confusion. In his hands were lists of current system problems and, in stark contrast, management meeting minutes marked "investment effect unclear."
"We're a trading company in Tokyo founded 68 years ago. We handle industrial products, construction materials, electronic components. Annual transaction volume ¥12 billion. However, the sales management system is holding us back."
Fleming's System Challenges: - Established: 1957 (trading company) - Annual revenue: ¥12B - Staff: 82 (Sales 48, Management 18, Logistics 16) - Current system: Introduced 2015 (operating 10 years) - Problems: - Slow processing (15 minutes for quotation creation) - Many analog operations (handwritten slips, Excel transcription) - Can't centrally manage (orders, inventory, billing separate) - Replacement estimate: ¥48M - Management concern: "Can we recover the investment?"
Deep anxiety filled Fleming's voice.
"The problem is we can't quantify 'what's problematic' about the current system. 'Slow,' 'hard to use,' 'takes effort'... Employees complain, but we don't know 'how much annual loss that is.' Management says 'investing ¥48M, can we recover?'"
Typical Operational Inefficiency:
Sales Rep A's Day:
9 AM: Phone call from customer requesting quotation
Customer: "Please quote 100 units of Product X."
Sales A: "Understood. Please give me about 15 minutes."
Quotation creation work begins:
- Log into sales management system (2 min startup)
- Search "Product X" from product master (3 min search)
- Check inventory (inventory system separate, 1 min switching)
- Check unit price (search from past transaction history, 5 min)
- Create quotation (create in system, 3 min)
- Output quotation to PDF (1 min)
Total: 15 minutes
Sales A: "Thank you for waiting. I'll email the quotation."
Daily quotations: Average 8 × 15 min = 2 hours
Accounting Staff B's Day:
2 PM: Invoice creation
- Extract current month's delivery data from sales management system
- Copy & paste data into Excel (manual)
- Create invoices in Excel (manual per customer)
- Print, put in envelopes, mail
Per company: 20 minutes Monthly billing destinations: 180 companies Monthly work hours: 60 hours (about 1 week)
Logistics Staff C's Day:
10 AM: Inventory check
Customer: "Product Y, in stock?"
Sales A: "I'll check with logistics. Please wait."
Internal call to logistics:
Sales A: "Product Y, in stock?"
Logistics C: "Let me check... (looks at inventory system)... Yes, 50 units."
Sales A: "Thank you."
Return call to customer:
Sales A: "Thank you for waiting. 50 units in stock."
Confirmation: 5 minutes Daily inventory checks: Average 20 times × 5 min = 100 min (1 hour 40 min)
Fleming sighed deeply.
"Such inefficiencies accumulate company-wide. But because we can't calculate 'annual loss amount,' we can't persuade management of replacement necessity."
Chapter 2: The Wall of Intuition—Can't Decide Without Numbers
"Mr. Fleming, how is the replacement proposal currently being submitted to management?"
To my question, Fleming answered.
"We explain 'Current system is old. Processing is slow. New system will improve operational efficiency.' However, management asks 'How much improvement?' 'Can we recover the ¥48M investment?' We can't answer."
Current Approach (Qualitative Explanation Type): - Explanation: "Efficiency will improve," "will be convenient" - Problem: Quantitative effects not shown - Result: Management can't decide
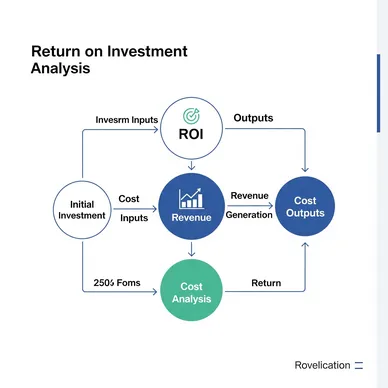
I explained the importance of visualizing return on investment.
"Investment is buying the future. ROI—Return on Investment. By quantifying return against investment, management can judge. Speak in numbers, not feelings."
⬜️ ChatGPT | Concept Catalyst
"Don't discuss investment by feeling. Quantify with ROI. Payback period generates decisions."
🟧 Claude | Story Alchemist
"Investment is buying the future. ROI transforms invisible value into numbers."
🟦 Gemini | Compass of Reason
"ROI is investment judgment technology. Accelerate decision-making with 3 elements: Cost, Effect, Payback Period."
The three members began analysis. Gemini deployed the "ROI Framework" on the whiteboard.
ROI Formula:
ROI(%) = (Profit - Investment) ÷ Investment × 100

Payback Period = Investment ÷ Annual Profit
"Mr. Fleming, let's calculate ROI for new system implementation together."
Chapter 3: Proof Through Visualization—Converting Work Hours to Amounts
Phase 1: Current Work Hour Measurement (2 weeks)
First, detailed measurement of work hours with current system.
Measurement targets: - Sales: Quotation creation, order entry, inventory check - Accounting: Invoice creation, payment confirmation, data aggregation - Logistics: Inventory management, shipping instructions, stocktaking
Measurement method: - 5 people from each department, record 2 weeks of work hours - Measure time required per task
Measurement Results (Monthly):
| Task | Department | Times/month | Time/instance | Monthly hours |
|---|---|---|---|---|
| Quotation creation | Sales 48 | 8/day | 15 min | 2,880 hours |
| Inventory check | Sales 48 | 20/day | 5 min | 2,400 hours |
| Order entry | Sales 48 | 5/day | 10 min | 1,200 hours |
| Invoice creation | Accounting 18 | 180 companies | 20 min | 60 hours |
| Data transcription | Accounting 18 | Daily | 2 hours | 432 hours |
| Inventory management | Logistics 16 | Daily | 3 hours | 384 hours |
Monthly total work hours: 7,356 hours
Phase 2: Post-New System Work Hour Prediction (1 week)
Consulted with new system vendor, calculated work hour reduction rate.
Predicted improvement: - Quotation creation: 15 min → 3 min (80% reduction) - Inventory check: 5 min → 30 seconds (90% reduction) - Invoice creation: Automation (95% reduction) - Data transcription: Elimination (100% reduction)
Predicted monthly work hours after improvement: 1,154 hours Monthly reduction: 6,202 hours (84% reduction)
Phase 3: Cost Conversion (1 week)
Converted work hours to monetary amounts.
Labor cost calculation: - Average hourly wage: ¥2,890 (company average) - Monthly reduction: 6,202 hours - Monthly reduction cost: ¥17,924,380 - Annual reduction cost: ¥215,092,560
Phase 4: ROI Calculation (1 day)
Calculated ROI including all costs.
Investment costs: - System introduction: ¥48M - Data migration: ¥8M - Training: ¥7M - Total investment: ¥63M
Operating costs: - Annual system operation: ¥4.8M
Annual net effect: - Reduction cost: ¥215,092,560 - Operating cost: -¥4,800,000 - Net effect: ¥210,292,560
ROI Calculation:
ROI = (¥210,292,560 - ¥63,000,000) ÷ ¥63,000,000 × 100
    = 233.8%

Payback Period = ¥63,000,000 ÷ ¥210,292,560 = 3.6 months
Phase 5: Management Presentation (1 day)
Presented ROI analysis to management.
Presentation content: - Annual loss from current system: ¥215M - New system investment: ¥63M - Payback period: 3.6 months - 5-year cumulative effect: ¥988M
Management decision: "Investment approved. Begin implementation immediately."
President's words: "3.6 months payback is outstanding. This isn't an expense, it's an investment. Approved."
Chapter 4: Results After Implementation—12 Months Later
Over 6 months, gradually implemented new system.
Implementation schedule: - Month 1-2: Requirements definition, customization - Month 3-4: Data migration, testing - Month 5: Training, parallel operation - Month 6: Full operation
Results After 12 Months:
Work Hour Reduction (Actual): - Monthly work hours: 7,356 hours → 1,280 hours (83% reduction) - Annual reduction hours: 72,912 hours (achieved 98.7% of predicted 73,884)
Operational Changes:
Sales Rep A: - Before: Quotation 15 min → After: 3 min (80% reduction) - Increased customer visits with freed time - Monthly visits: Average 40 companies → average 68 companies (+70%)
Accounting Staff B: - Before: Invoice creation 60 hours/month → After: 15 hours/month - Conducted financial analysis with freed time - "Previously barely kept up with invoices, now can do management-useful analysis"
Logistics Staff C: - Before: Inventory management 3 hours/day → After: 1 hour/day - Launched inventory optimization project with freed time - Succeeded in reducing excess inventory
Financial Results:
Reduction Cost (Actual): - Annual reduction cost: ¥210,910,000 (as predicted) - System operation cost: ¥4,800,000 annually - Net effect: ¥206,110,000
ROI (Actual):
ROI = (¥206,110,000 - ¥63,000,000) ÷ ¥63,000,000 × 100
    = 227%

Payback Period = 3.7 months (almost as predicted)
Revenue Impact: - New contracts increased through increased sales visits - Annual revenue: ¥12B → ¥13.2B (+10%)
President's Summary:
"Initially I was skeptical about system replacement: 'Is it really necessary?' ¥48M is no small amount.
However, seeing the ROI analysis number '3.6 months recovery,' I decided to invest. And actually recovered in 3.7 months.
Through operational efficiency, employees became able to focus on what they should truly do. Sales: customer visits, Accounting: financial analysis, Logistics: inventory optimization... Time spent 15 minutes creating quotations transformed into valuable time.
ROI is technology for visualizing investment value. Not intuitive explanation 'efficiency improves,' but the number '3.6 months recovery' enabled decision-making."
Chapter 5: The Detective's Diagnosis—Volume 27 "The Pursuit of Reproducibility" Conclusion
That night, I reflected on the essence of ROI.
Fleming suffered from system obsolescence. However, couldn't prove "worth investing."
Visualizing ROI accelerated decision-making. ¥200M annual inefficiency became clear in numbers, proving 3.6-month recovery possible.
"Investment is buying the future. ROI transforms invisible value into numbers."
Volume 27 "The Pursuit of Reproducibility" concludes here.
Through 10 cases from No.321 to No.330, we confirmed one truth again.
Business success is reproducible.
No.321's NexBridge aligned organizational direction with OKR. No.322's Frontier understood customer jobs through JTBD. No.323's SceneCast transformed space into behavior through Scene-Cast. No.324's BlueOcean avoided competition through Blue Ocean. No.325's Matrix Vision three-dimensionally visualized issues through 6D Matrix.
No.326's Empathy Design designed emotions through EMPATHY Map. No.327's JourneyWorks connected experiences through Customer Journey. No.328's Mandala Tech structured ideas through MANDALA Chart. No.329's ChronoAnalytics redesigned time through RCD Model.
And No.330's Fleming Enterprises quantified investment through ROI.
Reproducibility is technology for repeating one success repeatedly. And that technology can be mastered by anyone.
Volume 27 concludes here.
However, the detective's journey doesn't end. In the next volume, we'll step into even deeper reproducibility realms.
The lights at 221B Baker Street won't go out tonight either.
"Investment is buying the future. Quantify effects with ROI, show payback period. Not feelings, but numbers accelerate decision-making."—From the detective's notes
— End of Volume 27 "The Pursuit of Reproducibility" —
Related Files
🎖️ Top 3 Weekly Ranking of Classified Case Files
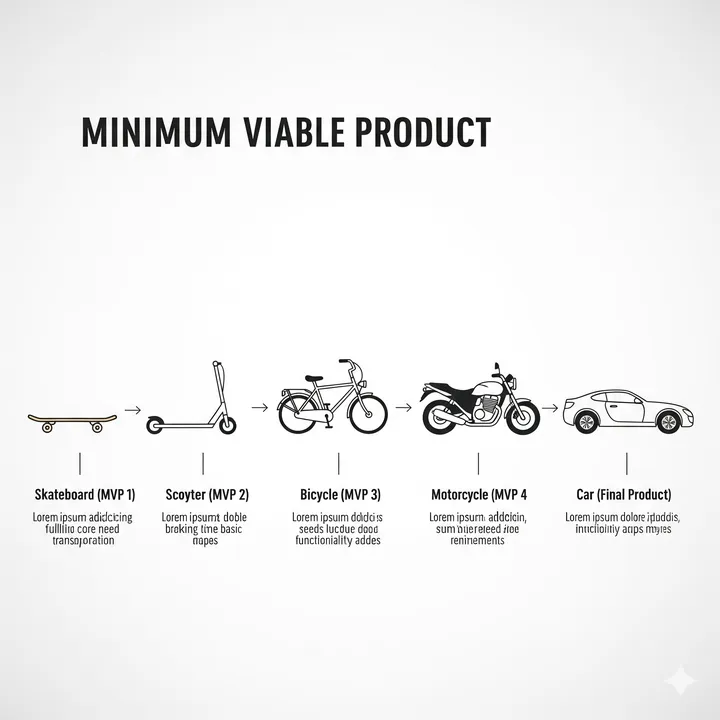
What is MVP
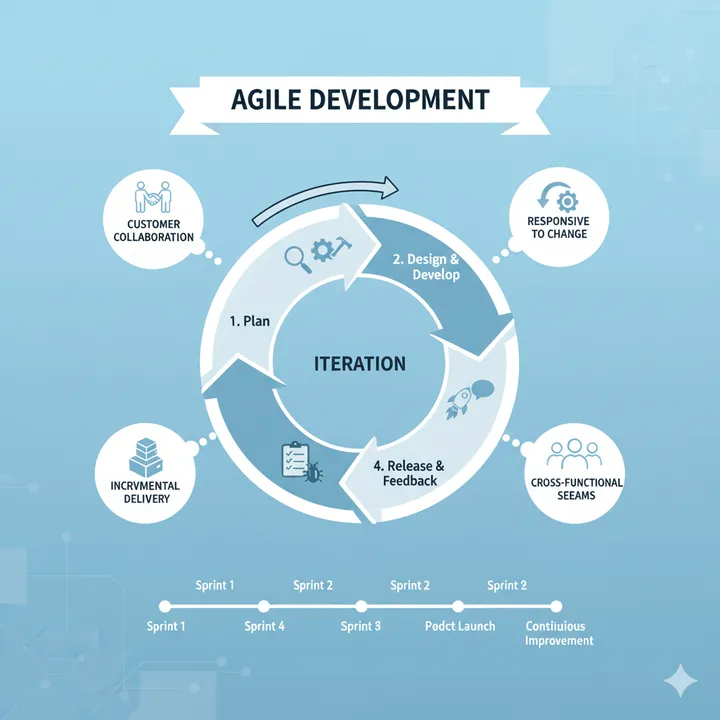
What is Agile Development
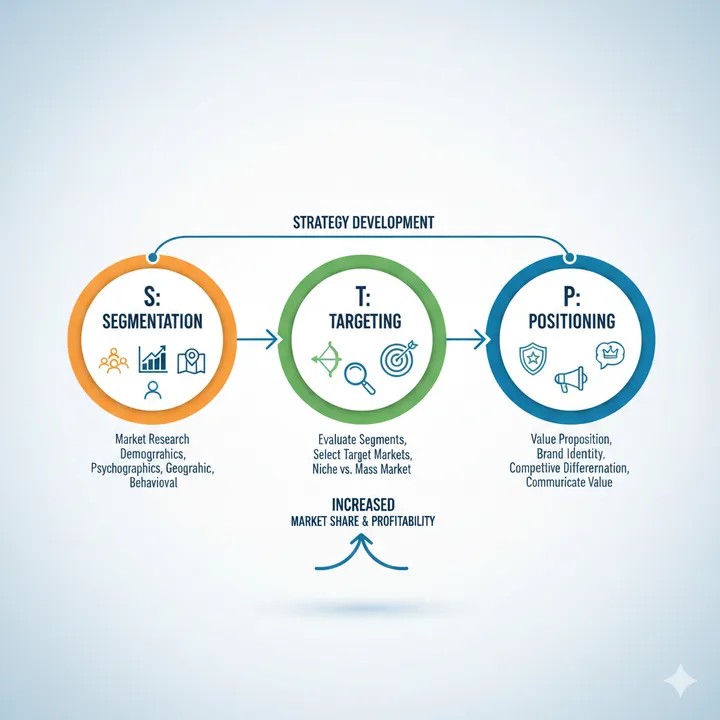
What is STP Analysis