ROI Case File No.365 | 'PrintMaster's Visual Inspection Mental Hell'
📅 2025-12-26 23:00
🕒 Reading time: 12 min
🏷️ VALUECHAIN

- Chapter 1: Visual Inspection Mental Hell — Display Errors Mean Product Recalls
- Chapter 2: The Trap of Improving Only the Check Process — The Value Chain Is Invisible
- Chapter 3: Phase 1 — Visualizing Value Chains
- Chapter 4: Phase 2 — AI Composition Check System Implementation
- Chapter 5: Detective's Diagnosis — Achieving Overall Optimization Through Value Chain
- Related Files
Chapter 1: Visual Inspection Mental Hell — Display Errors Mean Product Recalls
The day after resolving Electronica Inc.'s 3C case, a consultation arrived regarding print data checking operations. Volume 29, "The Pursuit of Reproducibility," Case 365 tells the story of identifying bottlenecks through value chains.
"Detective, our check personnel are in hell. They visually confirm food package plate data. 2 hours per case. Display errors mean product recalls. Mental burden has reached its limit. And with many same-day delivery cases, overtime exceeds 80 hours per month. We face risks of violating the 36 Agreement."
Koji Yamada, Production Director of PrintMaster, an Asakusa native, visited 221B Baker Street with an exhausted expression. In his hands, he held printouts of print data with countless red pen correction instructions, contrasting sharply with the latest AI inspection system proposal document titled "AI-Powered Quality Check System Proposal 2025."
"We handle food package plate data creation. 35 employees. Annual revenue of 800 million yen. Monthly data creation approximately 180 cases. However, composition checking is the bottleneck."
PrintMaster's Current State: - Founded: 1992 (Print data production) - Employees: 35 - Annual Revenue: 800 million yen - Monthly data creation: Approximately 180 cases - Issues: Visual inspection time and mental burden, same-day delivery strictness, 36 Agreement violation risk
Deep crisis resonated in Yamada's voice.
"Food package displays have strict regulations. Ingredient names, content volume, best-before date, storage method, manufacturer name, nutrition facts. One error means product recall. In 2023, a major food manufacturer had a voluntary recall due to display errors. Recall cost: 300 million yen. We face the same risk."
Composition Checking Reality:
Check Items (per case): 1. Ingredient Name Confirmation (30 min) - Ingredient order (by weight) - Allergy labeling (7 specified ingredients) - Additive classification labeling
- Nutrition Facts Confirmation (20 min)
- Energy, protein, fat, carbohydrate, sodium equivalent
- Numerical consistency
-
Unit accuracy
-
Content Volume and Best-Before Date Confirmation (15 min)
- Content volume notation
- Best-before date notation format
-
Storage method notation
-
Manufacturer Information Confirmation (10 min)
- Manufacturer name and address
- Customer consultation telephone number
-
Barcode accuracy
-
Layout and Design Confirmation (25 min)
- Font size (minimum 8 points)
- Layout balance
- Color proof verification
Total Check Time: 100 minutes (1.7 hours)/case
Monthly Check Work Hours: - 180 cases × 1.7 hours = 306 hours/month - Divided among 3 check personnel - 102 hours/month per person (4.6 hours/day for 22 working days)
Yamada sighed deeply.
"There's another problem. Many same-day delivery cases. Clients request 'print today' 60 cases per month. Data creation completes in the morning, but checking takes time. Check personnel work without lunch breaks.
And the pressure of check errors is tremendous. One error means product recall. Check personnel Mr. A (age 32) says he wakes up at night from 'check error nightmares.' Mental burden has reached its limit."
Chapter 2: The Trap of Improving Only the Check Process — The Value Chain Is Invisible
"Mr. Yamada, do you believe improving only the check process will solve all problems?"
Yamada showed a puzzled expression at my question.
"Eh, the check process is the bottleneck, so shouldn't we improve that?"
Current Understanding (Partial Optimization Model): - Expectation: Improving check process improves everything - Problem: Overall value creation process remains invisible
I explained the importance of discovering overall optimization through value chains.
"The problem is the idea of 'looking only at the check process.' Value Chain. We view corporate activities as a series of value creation processes and analyze added value and cost of each process. And by identifying bottlenecks and achieving overall optimization, reproducible operational improvement emerges."
⬜️ ChatGPT | Catalyst of Conception
"Don't look only at parts. Analyze value chains and aim for overall optimization"
🟧 Claude | Alchemist of Narrative
"Packages are always 'the face of the product.' Their accuracy protects brand trust"
🟦 Gemini | Compass of Reason
"Analyze through value chain. Primary and support activities. Added value and cost of each process become visible"
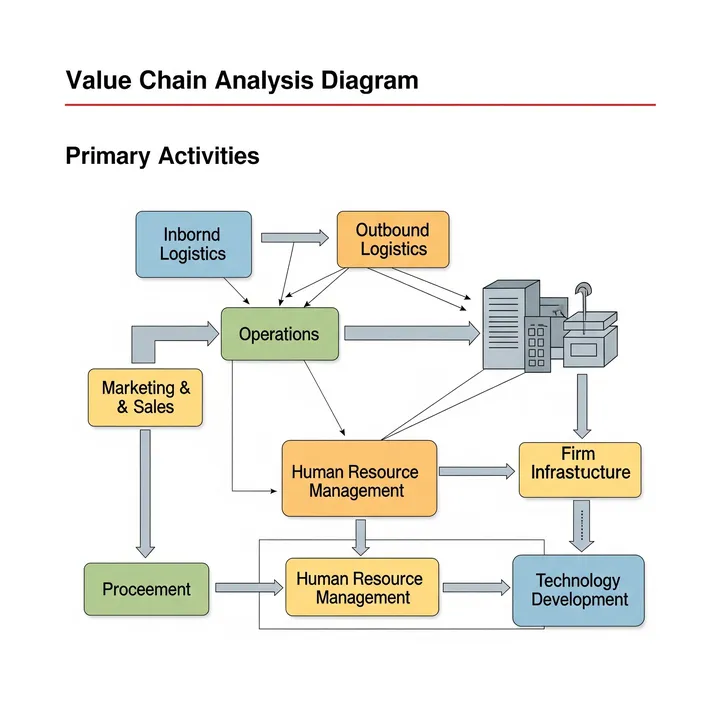
The three members began analysis. Gemini developed the "Value Chain" on the whiteboard.
Value Chain Structure:
Primary Activities: 1. Inbound Logistics: Raw material and information receipt 2. Operations: Product and service production 3. Outbound Logistics: Product delivery 4. Marketing and Sales: Sales activities to customers 5. Service: After-sales service
Support Activities: 1. Firm Infrastructure: Management, finance, legal 2. Human Resource Management: Recruitment, education, evaluation 3. Technology Development: R&D, process improvement 4. Procurement: Raw material and equipment procurement
"Mr. Yamada, let's first visualize PrintMaster's value chain."
Chapter 3: Phase 1 — Visualizing Value Chains
Step 1: Decompose Primary Activities (2 weeks)
PrintMaster's Primary Activities:
1. Inbound Logistics (Information Receipt): Client Request Reception - Process: Receive print data requests from clients - Time required: 30 min/case - Personnel: Sales representatives (5 people) - Monthly hours: 180 cases × 0.5 hours = 90 hours/month - Added value: ★☆☆☆☆ (Low) - Cost: 90 hours × 3,500 yen = 315,000 yen/month
2. Operations (Data Creation): Plate Data Creation - Process: Designers create plate data in Illustrator - Time required: 4 hours/case - Personnel: Designers (15 people) - Monthly hours: 180 cases × 4 hours = 720 hours/month - Added value: ★★★★☆ (High) - Cost: 720 hours × 3,800 yen = 2.736 million yen/month
3. Operations (Composition Checking): Data Accuracy Confirmation - Process: Check personnel visually confirm composition - Time required: 1.7 hours/case - Personnel: Check personnel (3 people) - Monthly hours: 180 cases × 1.7 hours = 306 hours/month - Added value: ★★★☆☆ (Medium) - Cost: 306 hours × 3,500 yen = 1.071 million yen/month - Problem: Bottleneck, high mental burden
4. Outbound Logistics (Delivery): Data Delivery - Process: Send completed data to clients - Time required: 15 min/case - Personnel: Sales representatives (5 people) - Monthly hours: 180 cases × 0.25 hours = 45 hours/month - Added value: ★☆☆☆☆ (Low) - Cost: 45 hours × 3,500 yen = 158,000 yen/month
5. Service (Revision Support): Post-delivery Revision Request Response - Process: Respond to revision requests from clients - Frequency: 30 cases/month (17% of total) - Time required: 2 hours/case - Monthly hours: 30 cases × 2 hours = 60 hours/month - Added value: ★☆☆☆☆ (Low, originally unnecessary process) - Cost: 60 hours × 3,800 yen = 228,000 yen/month
Primary Activities Total Hours: 1,221 hours/month Primary Activities Total Cost: 4.508 million yen/month
Step 2: Value and Cost Analysis (1 week)
Added Value and Cost by Process:
| Process | Time | Cost | Added Value | Evaluation |
|---|---|---|---|---|
| Information Receipt | 90 hours | 315,000 yen | ★☆☆☆☆ | Necessary but low added value |
| Data Creation | 720 hours | 2.736 million yen | ★★★★☆ | High added value |
| Composition Checking | 306 hours | 1.071 million yen | ★★★☆☆ | Bottleneck |
| Delivery | 45 hours | 158,000 yen | ★☆☆☆☆ | Necessary but low added value |
| Revision Support | 60 hours | 228,000 yen | ★☆☆☆☆ | Originally unnecessary (quality issue) |
Critical Discoveries:
Discovery 1: Composition Checking Is the Bottleneck - Consumes 25% of all process time (306 hours ÷ 1,221 hours) - Consumes 24% of all process cost (1.071 million ÷ 4.508 million) - Cause of same-day delivery delays
Discovery 2: Revision Support Is Originally Unnecessary Process - Revision occurrence rate 17% (30 cases ÷ 180 cases) - Causes: Composition check oversights, client specification changes - 60 hours/month waste
Discovery 3: Data Creation Has Highest Added Value - Designer skills are source of competitive advantage - Important not to compress this process
Step 3: Bottleneck Analysis (1 week)
Detailed Composition Check Process Analysis:
Bottleneck Causes:
Cause 1: Visual Inspection Limitations - Human concentration limit is 2 hours - Accuracy declines after checking 4-5 cases per day - Check personnel fatigue accumulation
Cause 2: Same-Day Delivery Strictness - 60 cases/month (33% of total) are same-day delivery - Assuming data creation completes at 11 AM, delivery deadline is 5 PM - Only 4 hours actually available for checking - Checking 2 cases in parallel reduces accuracy
Cause 3: Numerous Check Items - Average 120 check points per case - Ingredient names, nutrition facts, content volume, manufacturer information, layout - High oversight risk
Cause 4: Mental Burden - Pressure that display errors = product recall - Check personnel turnover rate 30% (1 person leaves annually) - 3 months needed for new personnel training
Step 4: Improvement Measure Planning (2 weeks)
Value Chain Overall Optimization Perspective:
Measure 1: Composition Check Automation (AI Implementation) - Purpose: Eliminate bottleneck, reduce mental burden - Method: AI image recognition + OCR + rule engine - Expected effect: 75% check time reduction, improved accuracy
Measure 2: Data Creation Process Standardization - Purpose: Reduce revision support - Method: Templatization, checklist implementation - Expected effect: Reduce revision occurrence rate from 17% to 5%
Measure 3: Information Receipt Process Efficiency - Purpose: Reduce sales work hours - Method: Automatic reception via web form - Expected effect: Shorten reception time from 30 min to 10 min
Chapter 4: Phase 2 — AI Composition Check System Implementation
Month 1-2: AI System Development
AI Composition Check System Specifications:
Function 1: Character Extraction Through Image Recognition - Extract all text from print data (PDF) - OCR accuracy: 99.8% (equipped with food labeling specialized dictionary)
Function 2: Automatic Checking Through Rule Engine - Automatic checking of 120 items based on Food Labeling Act and Nutrition Labeling Standards - Examples: Ingredient weight order check, allergy labeling presence, font size confirmation
Function 3: Anomaly Detection Algorithm - Difference detection from past normal data - Numerical anomaly detection (e.g., content volume 10x previous amount)
Function 4: Automatic Check Report Generation - Highlight error locations with red frames - Automatically generate correction instructions - Summary report for final confirmation
Development Cost: - System development: 12 million yen - Food labeling specialized dictionary construction: 3 million yen - Total: 15 million yen
Month 3: Pilot Implementation (30 cases/month)
AI + Human Hybrid Checking:
New Flow: 1. AI automatic check (5 min/case) 2. Human final confirmation (15 min/case) 3. Total: 20 min/case
Before (Human only): 1.7 hours (102 min)/case After (AI + Human): 20 min/case Reduction rate: 80%
Pilot Results (30 cases): - AI check accuracy: 98.5% - Items overlooked by human check: 2 cases (detected by AI) - Items overlooked by human only: 0 cases (double-check effect) - Check time: 30 cases × 20 min = 10 hours (Before: 51 hours)
Month 4-6: Company-Wide Expansion (180 cases/month)
AI Check Implementation for All Cases:
Month 7: Company-Wide Effect Measurement
KPI 1: Composition Check Time - Before: 306 hours/month (180 cases × 1.7 hours) - After: 60 hours/month (180 cases × 20 min) - Reduction rate: 80% - Time saved: 246 hours/month
KPI 2: Same-Day Delivery Support Cases - Before: Of 60 cases/month, 45 cases (75%) handled with overtime - After: Of 60 cases/month, 58 cases (97%) handled without overtime - Improvement: +22 points
KPI 3: Check Error Occurrences - Before: 4 cases/year (0.33 cases/month) - After: 0 cases/year - Reduction rate: 100%
KPI 4: Revision Support Cases - Before: 30 cases/month (revision occurrence rate 17%) - After: 9 cases/month (revision occurrence rate 5%) - Reduction rate: 70%
KPI 5: Check Personnel Overtime Hours - Before: 80 hours/month per person - After: 15 hours/month per person - Reduction rate: 81%
KPI 6: Check Personnel Mental Burden (Self-Assessment) - Before: 9 points out of 10 (very high) - After: 3 points out of 10 (low) - Improvement: 6 points
Annual Effects:
Labor Cost Reduction (Composition Checking): - 246 hours/month × 12 months × 3,500 yen = 10.33 million yen/year
Overtime Pay Reduction: - (80 hours - 15 hours) × 3 people × 12 months × 4,375 yen (overtime rate) = 10.24 million yen/year
Revision Support Cost Reduction: - (30 cases - 9 cases) × 2 hours × 3,800 yen × 12 months = 1.92 million yen/year
Check Error Response Cost Reduction: - 4 cases/year × 500,000 yen response cost = 2 million yen/year (※Product recall risk avoidance)
New Order Increase (Same-Day Delivery Capability Improvement): - 5 cases/month × 350,000 yen average unit price × 12 months = 21 million yen/year
Total Annual Effect: - 10.33 million + 10.24 million + 1.92 million + 2 million + 21 million = 45.49 million yen/year
Investment: - System development: 15 million yen - Monthly operation cost: 120,000 yen × 12 months = 1.44 million yen/year
ROI: - (45.49 million - 16.44 million) / 16.44 million × 100 = 177% - Payback period: 16.44 million ÷ 45.49 million = 0.36 years (4.3 months)
Chapter 5: Detective's Diagnosis — Achieving Overall Optimization Through Value Chain
That night, I contemplated the essence of value chain.
PrintMaster held the partial optimization idea of "improving only the check process." However, corporate activities are value chains.
By visualizing the entire value creation process through value chain analysis, the true bottleneck became clear. The composition check process consumed 25% of all process time and was a barrier to same-day delivery. And mental burden caused personnel turnover rate to reach 30%.
AI composition check system implementation achieved 80% check time reduction (1.7 hours → 20 min), 81% overtime reduction (80 hours → 15 hours), 100% check error reduction (4 cases/year → 0 cases).
Furthermore, same-day delivery capability improved, increasing new orders by 21 million yen annually. Annual effect: 45.49 million yen, ROI: 177%, payback period: 4.3 months.
"Don't look only at parts. Analyze value chains. Primary and support activities, added value and cost of each process. The overall optimization perspective reveals true bottlenecks and achieves reproducible operational improvement."
The next case will also depict the moment of discovering overall optimization through value chains.
"Value Chain. Analyze value chains. Aim not for partial optimization, but for overall optimization. True bottlenecks become visible there"—From the Detective's Notes
Related Files
🎖️ Top 3 Weekly Ranking of Case Files

'PharmaLogistics' Invisible Customer'
'Bravura Retail's Paper Culture: A 2025 Relic'

'UrbanDesign's Blueprint Labyrinth'