ROI Case File No.370 | 'Optimus Solutions' Excel Personalization'
📅 2025-12-31 23:00
🕒 Reading time: 13 min
🏷️ AARRR

- Chapter 1: Excel Personalization — Tacit Knowledge That Cannot Be Handed Over
- Chapter 2: One-Shot System Implementation — Adoption Process Not Visible
- Chapter 3: Phase 1 — Designing Growth Strategy Through AARRR
- Chapter 4: Year 2 Onward Growth and Organizational Change
- Chapter 5: Detective's Diagnosis — Designing 5 Stages of Growth Through AARRR
- Related Files
Chapter 1: Excel Personalization — Tacit Knowledge That Cannot Be Handed Over
The day after resolving Acme Data Solutions' JOURNEY case, a consultation arrived regarding business system DX promotion. Volume 29, "The Pursuit of Reproducibility," Case 370, the final case, tells the story of achieving adoption through 5 stages of growth.
"Detective, all our operations are in Excel. Site management, progress management, number management. Each sales representative creates their own Excel files. However, managers cannot grasp progress. Handovers also cannot proceed smoothly. DX promotion policy was issued starting April 2025, but internal IT literacy is low and we don't know how to proceed."
Kenji Sato, Business Reform Director of Optimus Solutions, an Osaka native, visited 221B Baker Street with a confused expression. In his hands, he held massive Excel files created in different formats by each sales representative, contrasting sharply with the latest DX strategy document titled "Digital Transformation Strategy 2025-2027."
"We provide material management systems for construction sites. 50 employees. Annual revenue of 800 million yen. 15 sales staff, 25 engineers, 10 administrators. However, sales business management is personalized."
Optimus Solutions' Current State: - Founded: 2015 (Material management systems for construction sites) - Employees: 50 (15 sales staff) - Annual Revenue: 800 million yen - Issues: Excel management personalization, progress oversight difficulty, low IT literacy, handover impossible
Deep anxiety resonated in Sato's voice.
"Let me explain sales operations. First, site management. We manage projects by construction site. Customer name, site name, progress status, next visit schedule. Each sales representative manages this in Excel. However, formats vary. Person A has customers on vertical axis, dates on horizontal axis. Person B has projects on vertical axis, status on horizontal axis. Not unified.
Next, progress management. Each project has 5 stages: proposal → quotation → contract → implementation → operation. Each sales representative manages in Excel, but managers cannot grasp it centrally. When asked 'How many projects are expected to contract this month?', they cannot answer immediately.
Finally, number management. Sales, gross profit, order count. This is also managed in Excel. However, aggregation takes time. At month end, we collect Excel individually from 15 sales staff and aggregate manually. Takes 3 days."
Excel Management Reality:
Site Management (15 sales staff, each with unique format): - Person A's format: Customer name, site name, progress, next visit (vertical: customer, horizontal: date) - Person B's format: Project name, status, person in charge, amount (vertical: project, horizontal: status) - Person C's format: Customer code, project code, phase, probability (uses unique codes) - Uniformity: 0% (15 people have 15 different formats)
Progress Management (5 stages): 1. Proposal: Initial visit, challenge hearing 2. Quotation: Submit quotation 3. Contract: Contract signing 4. Implementation: System implementation 5. Operation: Begin production operation
Problem: - Each sales representative manages in Excel, manager cannot grasp overall - "How many contracts expected this month?" → Aggregation takes half day
Number Management (Month-End Aggregation): - Each sales representative records sales, gross profit, order count in Excel - Manager collects Excel at month end (15 files) - Manual aggregation (3 days) - Aggregation errors occur 2-3 times monthly
Sato sighed deeply.
"There's another problem. Handovers are impossible. Last year, sales representative D retired. We tried to hand over to successor E, but D's Excel was too complex to understand. Macros were built in, over 200 formulas. E was confused saying 'I don't know where to look.' Eventually, handover took 1 month.
ANDPAD, a site management system, has been decided for implementation in fiscal 2025. However, for 'progress management' and 'number management', we're still selecting systems. Candidate is Salesforce, but we're uncertain whether sales staff with low IT literacy can master it."
Chapter 2: One-Shot System Implementation — Adoption Process Not Visible
"Mr. Sato, do you believe implementing Salesforce will solve all problems?"
Sato showed a confused expression at my question.
"Yes, I believe implementing a system will eliminate personalization. However, if sales staff don't use it, it's meaningless. That's what worries me."
Current Understanding (System Implementation Model): - Expectation: Salesforce implementation eliminates personalization - Problem: Adoption process not visible, meaningless if not used
I explained the importance of achieving adoption through 5 stages of growth.
"The problem is the idea that 'implementation ends everything.' AARRR—Acquisition, Activation, Retention, Referral, Revenue. We design growth strategy in these 5 stages. For systems, implementation is not the goal—adoption is the goal. Reproducible adoption emerges from 5-stage growth strategy."
⬜️ ChatGPT | Catalyst of Conception
"Don't end with implementation. Design 5-stage growth strategy from acquisition to revenue through AARRR"
🟧 Claude | Alchemist of Narrative
"Systems are always just 'tools.' If users don't grow, it's pearls before swine"
🟦 Gemini | Compass of Reason
"Design through AARRR. Acquisition, activation, retention, referral, revenue. When 5 stages align, true growth is realized"
The three members began analysis. Gemini developed the "AARRR Framework" on the whiteboard.
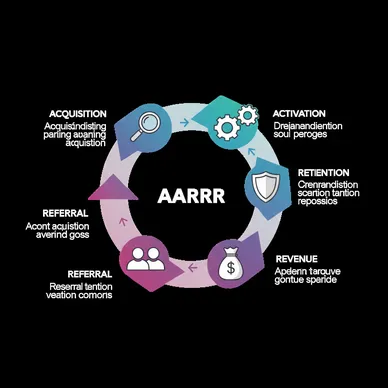
AARRR's 5 Stages: 1. Acquisition: Acquire users 2. Activation: Make them realize value in first experience 3. Retention: Make them use continuously 4. Referral: Make them introduce to other users 5. Revenue: Generate revenue
"Mr. Sato, let's first design Salesforce implementation through AARRR's 5 stages."
Chapter 3: Phase 1 — Designing Growth Strategy Through AARRR
Step 1: Acquisition Stage Design (Month 1-2)
Goal: All 15 sales staff acquire Salesforce accounts and log in
Month 1: Salesforce Contract and Initial Setup
Contract Details: - Plan: Salesforce Sales Cloud Professional - Price: 9,000 yen/month per user × 15 people = 135,000 yen/month - Initial setup cost: 500,000 yen (customization, data migration)
Initial Setup: - Project management: Set 5 stages of proposal → quotation → contract → implementation → operation - Dashboard: Sales by sales staff, progress status, order count - Mobile app: Input from outside via iPhone app
Month 2: Account Issuance to All 15 Sales Staff
Kickoff Meeting: - Participants: 15 sales staff, 5 managers - Content: Explain DX promotion background, explain Salesforce merits - Message: "Freed from Excel management, focus on core sales activities"
Account Issuance: - Issue accounts to all 15 sales staff - Individual support for login method (30 minutes per person)
Acquisition KPI: - Goal: All 15 people log in - Result: All 15 people logged in (100% achievement rate)
Step 2: Activation Stage Design (Month 3)
Goal: 15 sales staff realize Salesforce value in initial experience
Month 3: Quick Win Strategy
What is Quick Win: - Accumulate small successful experiences in short period - Make them realize Salesforce value
Specific Measures:
Measure 1: Start with easiest function - Customer information registration only (not project management yet) - Reason: Customer information registration is easy to understand, easy to accumulate successful experiences
Measure 2: Gamification - Execute "Customer Information Registration Campaign" - Goal: 10 customer information registrations per person (1 week) - In-company commendation for achievers (5,000 yen Amazon gift certificate)
Measure 3: Individual Support - Individual support for 3 sales staff with low IT literacy (2 hours each) - Register together while sharing screen
Month 3 Results:
Customer Information Registration Count: - Goal: 150 cases (15 people × 10 cases) - Result: 178 cases (119% achievement rate) - Most registrations: Person A 18 cases - Least registrations: Person B 8 cases (individual support implemented)
Sales Staff Voice: "At first I thought 'Another new system.' But when I register customer information, I can view it on smartphone too. It's convenient to check customer information while outside." (Sales staff C)
Activation KPI: - Goal: All 15 people register 10+ cases - Result: 13 people registered 10+ cases (87% achievement rate) - 2 who didn't achieve: Continue individual support
Step 3: Retention Stage Design (Month 4-6)
Goal: Create habit of 15 sales staff using Salesforce daily
Month 4: Begin Full-Scale Project Management Operation
Establish Operation Rules: - Every day 9 AM: Register today's visit schedule in Salesforce - After visit: Immediately update progress status (which of 5 stages) - Every Friday 5 PM: Register next week's schedule
Habituation Mechanisms:
Mechanism 1: Progress Sharing at Morning Meeting - Sales team morning meeting at 9:15 AM daily - Share Salesforce dashboard screen - Each person orally confirms today's schedule
Mechanism 2: Weekly Review - Weekly review every Friday at 5 PM - Confirm this week's progress, next week's schedule in Salesforce - "How many contracts expected this month?" → Display immediately in Salesforce
Mechanism 3: Reminder Notifications - Smartphone notification 1 hour before visit schedule - Reminder daily at 6 PM for projects missing progress updates
Month 4-6 Results:
Daily Login Rate: - Month 4: 73% (11 of 15 people log in daily) - Month 5: 87% (13 of 15 people log in daily) - Month 6: 93% (14 of 15 people log in daily)
Progress Update Rate: - Month 4: 65% (rate of updating progress after visit) - Month 5: 82% - Month 6: 91%
Sales Staff Voice: "At first it was troublesome. I was used to Excel. But when I look at the dashboard at morning meeting, I can see my progress at a glance. I immediately understand 'How many more contracts do I need to achieve my goal this month.' At weekly review too, when asked 'What are this month's contract prospects?', I can answer immediately. Trust from manager also increased." (Sales staff D)
Retention KPI: - Goal: Daily login rate 80% or higher - Result: Month 6 at 93% (116% achievement rate)
Step 4: Referral Stage Design (Month 7-9)
Goal: Sales team introduces Salesforce goodness to other departments, realizing company-wide expansion
Month 7: Share Sales Team Success Cases Company-Wide
Presentation at Company-Wide Meeting: - Sales director presents success cases at company-wide meeting - Content: - Escaped Excel management, realized progress visualization - Month-end aggregation time: 3 days → 1 hour (95% reduction) - Handover time: 1 month → 1 week (75% reduction) - Sales activity time: 80 hours/month → 100 hours/month increased (administrative work reduced)
Response From Other Departments: "Engineering department also does project management in Excel. Could we improve efficiency using Salesforce?" (Engineering Director)
Month 8-9: Horizontal Expansion to Engineering Department
Engineering Department Challenges: - Implement project management in Excel - Progress oversight difficult - Work hour aggregation takes time
Salesforce Extension: - Add project management function - Issue accounts to 25 engineers - Sales team provides implementation support (knowledge sharing)
Month 9 Results: - 25 engineers begin Salesforce usage - Expanded to 40 company-wide (15 sales + 25 engineers)
Referral KPI: - Goal: Expansion to 1 other department - Result: Expanded to 25 engineers in engineering department (100% achievement rate)
Step 5: Revenue Stage Design (Month 10-12)
Goal: Improve sales and profit through Salesforce utilization
Month 10-12: Realize Data-Driven Sales
Data Utilization Measures:
Measure 1: Project Probability Analysis - Analyze Salesforce data - Calculate "probability of progressing from proposal to quotation" "probability of progressing from quotation to contract" - Results: - Proposal → Quotation: 60% - Quotation → Contract: 45% - Proposal → Contract: 27%
Measure 2: Focus on High-Probability Projects - Prioritize visits to projects with high contract probability - Reduce visit frequency to low-probability projects - Result: Improved sales efficiency, improved order rate
Measure 3: Lost Order Reason Analysis - Record reasons for lost orders in Salesforce - Aggregate by reason: - Price (45%), Feature shortage (30%), Competition (15%), Other (10%) - Countermeasures: Improve price negotiation, propose feature additions
Year 1 Results (Month 12):
Sales Improvement: - Before (2024): Annual revenue 800 million yen - After (2025): Annual revenue 920 million yen - Improvement rate: +15% (+120 million yen)
Order Count Improvement: - Before: 120 orders/year - After: 145 orders/year - Improvement rate: +21% (+25 orders)
Sales Per Sales Staff: - Before: 800 million ÷ 15 people = 53.33 million yen/person - After: 920 million ÷ 15 people = 61.33 million yen/person - Improvement rate: +15%
Gross Profit Improvement: - Before: 35% gross margin → 280 million yen - After: 38% gross margin (through efficiency) → 350 million yen - Increase: +70 million yen
Revenue KPI: - Goal: Sales +10% - Result: Sales +15% (150% achievement rate)
Investment vs. Effect (Year 1):
Investment: - Salesforce usage fee: 135,000 yen/month × 12 months = 1.62 million yen - Initial setup cost: 500,000 yen - Training cost: 300,000 yen - Total: 2.42 million yen
Effect: - Gross profit improvement: +70 million yen - Administrative work reduction: 3 days → 1 hour (month-end aggregation), labor cost reduction approximately 3 million yen/year - Handover efficiency: 1 month → 1 week, labor cost reduction approximately 2 million yen/year - Total effect: 75 million yen/year
ROI (Year 1): - (75 million - 2.42 million) / 2.42 million × 100 = 2,999% - Payback period: 2.42 million ÷ 75 million = 0.03 years (11 days)
Chapter 4: Year 2 Onward Growth and Organizational Change
Year 2 (2026): Company-Wide Expansion Complete
Target Department Expansion: - Sales department: 15 people - Engineering department: 25 people - Administrative department: 10 people - Total: 50 people (company-wide)
Salesforce Usage Fee: - 9,000 yen/month × 50 people = 450,000 yen/month - Annual 5.4 million yen
Year 2 Effect: - Sales: 920 million yen → 1.08 billion yen (+17%) - Gross profit: 350 million yen → 430 million yen (+23%) - Labor cost reduction through company-wide operational efficiency: 8 million yen/year
Year 2 ROI: - (80 million - 5.4 million) / 5.4 million × 100 = 1,381%
Sales Director's Voice:
"Designing 5-stage growth strategy through AARRR was the key to success. Acquisition with account issuance, Activation with quick wins, Retention with habituation, Referral with other department expansion, Revenue with sales improvement.
Especially quick wins in Activation stage were important. Rather than using complex functions from the start, we began with the simple function of 'customer information registration.' Through gamification we accumulated successful experiences and made them realize 'Salesforce is convenient.'
In Retention stage, we habituated through morning meetings and weekly reviews. By creating a 'daily usage mechanism,' we achieved 93% daily login rate.
And in Referral stage, sales team success cases spread to other departments. I was happy when engineering department said 'We want to use it too.'
In Revenue stage, we realized data-driven sales. Through Salesforce data analysis, we focused on high-probability projects and improved sales by 15%. Year 1 ROI 2,999%, payback period 11 days. Year 2 also 17% sales improvement.
AARRR is the compass for system adoption. When 5 stages align, true growth is realized."
Chapter 5: Detective's Diagnosis — Designing 5 Stages of Growth Through AARRR
That night, I contemplated the essence of AARRR.
Optimus Solutions held the one-shot idea of "implementation of Salesforce is the end." However, for systems, implementation is not the goal—adoption is the goal.
AARRR—Acquisition, Activation, Retention, Referral, Revenue. We designed growth strategy in 5 stages.
In Acquisition we acquired accounts, in Activation we made them realize value through quick wins, in Retention we achieved adoption through habituation, in Referral we had them introduce to other departments, in Revenue we realized sales improvement.
93% daily login rate, 15% sales improvement, 70 million yen gross profit increase, ROI 2,999%, payback period 11 days. In Year 2, completed company-wide expansion, 17% sales improvement, ROI 1,381%.
And Volume 29, "The Pursuit of Reproducibility," all 10 cases are complete. PDCA, PPM, RFM, VRIO, 3C, Value Chain, MANDALA, BSC, EMPATHY, JOURNEY, AARRR. Through 11 frameworks, we achieved reproducible transformation.
"Don't end with implementation. Design 5 stages of growth through AARRR. Acquisition, activation, retention, referral, revenue. When 5 stages align, systems are adopted and true growth is realized. Growth strategy design creates reproducible adoption."
The next case will also depict the moment of achieving adoption through 5 stages of growth.
And the doors of ROI Detective Agency remain open today.
"AARRR—Acquisition, Activation, Retention, Referral, Revenue. Design 5-stage growth strategy. For systems, adoption is the goal, not implementation. Growth design realizes true transformation"—From the Detective's Notes
"We record and analyze experiences to pursue reproducibility. We build small worlds and connect them. Volume 29, Complete"—From the Director's Journal
Related Files
🎖️ Top 3 Weekly Ranking of Case Files

'PharmaLogistics' Invisible Customer'

'PrintMaster's Visual Inspection Mental Hell'

'Bravura Retail's Paper Culture: A 2025 Relic'