ROI Case File No.373 | 'WonderWorks Inc.'s 7-Department Fragmented Excel Hell'
📅 2026-01-03 23:00
🕒 Reading time: 10 min
🏷️ LEAN

- Chapter 1: 7-Department Chaos—Consolidation Hell at Month-End
- Chapter 2: The Illusion of Budget Management System Implementation—The Essence of Waste Is Invisible
- Chapter 3: Phase 1—Identifying and Eliminating the 7 Wastes
- Chapter 4: Phase 2—Continuously Improving Value Flow
- Chapter 5: Detective's Diagnosis—Eliminating Waste and Creating Value Flow
- Related Files
Chapter 1: 7-Department Chaos—Consolidation Hell at Month-End
The day after resolving NeuroPlay Inc.'s MECE case, a consultation arrived regarding budget management efficiency. Volume 30, "The Pursuit of Reproducibility," Case 373 tells the story of creating value flow by thoroughly eliminating waste.
"Detective, our accounting department sees hell every month. At month-end, we receive budget management Excel files from 7 departments. But all formats are different. Column order, item names, consolidation methods. Everything is fragmented. Consolidating these into one takes 3 days. And when budget changes occur, we start from scratch again."
Kenta Tanaka, Accounting Director of WonderWorks Inc. from Kanda, visited 221B Baker Street with an exhausted expression. In his hands were a USB drive containing 7 differently formatted Excel files, and in stark contrast, a budget management system implementation proposal titled "Budget Management System Proposal 2026."
"We are a construction consulting company. 280 employees. Annual revenue of 4.5 billion yen. We have 7 business divisions. But budget management is not unified. Each department manages with their own Excel."
WonderWorks Inc.'s Current State: - Founded: 2005 (construction consulting) - Employees: 280 - Annual revenue: 4.5B yen - Business divisions: 7 (urban planning, civil engineering, architecture, environment, transportation, disaster prevention, IT) - Issues: Inconsistent budget management formats, enormous consolidation work, difficult change management
Deep fatigue permeated Tanaka's voice.
"Excel formats for each department are as follows: Urban Planning: 5-digit account codes, 3 sheets for monthly/quarterly/annual. Civil Engineering: 4-digit account codes, 1 monthly sheet only, macro consolidation. Architecture: Text account names, 2 sheets for weekly/monthly. Environment: Original classification, 3-column structure for budget/actual/variance. Transportation: By project code, no monthly consolidation. Disaster Prevention: By expense category, quarterly only. IT: Cloud and on-premise managed separately. Everything is fragmented."
Reality of Monthly Consolidation Work:
Step 1: Collecting Excel from Departments (1 day) - Accounting sends reminder emails to 7 departments - Department submission deadline: Within 5 business days from month-end - Actual submission status: Average 7 business days (chronic delays)
Step 2: Format Unification Work (3 days) - Open Urban Planning Excel → Convert account codes to standard format - Execute Civil Engineering macro → Error occurs → Manual consolidation - Aggregate Architecture weekly data to monthly - Convert Environment's original classification to standard accounts - Re-consolidate Transportation project-based data by account - Prorate Disaster Prevention quarterly data to monthly - Integrate IT cloud and on-premise Total time required: 24 hours (3 days)
Step 3: Company-Wide Consolidation and Executive Report Creation (1 day) - Integrate 7 department data - Calculate budget/actual/variance - Create graphs and tables - Create executive report PowerPoint Total time required: 8 hours (1 day)
Total Monthly Consolidation Effort: 5 days (40 hours) Annual Consolidation Effort: 5 days × 12 months = 60 days (480 hours)
Tanaka sighed deeply.
"There's another problem. Budget changes. When project billing timing shifts, we must revise budgets. But we contact all 7 departments, have them modify Excel, and re-consolidate. This occurs an average of 3 times per month. 2 days per time. 6 days per month. 72 days annually. Budget management alone consumes 132 days (1,056 hours) per year."
Chapter 2: The Illusion of Budget Management System Implementation—The Essence of Waste Is Invisible
"Tanaka-san, do you believe implementing a budget management system will solve all problems?"
Tanaka answered immediately.
"Yes, I expect that. I've heard that inputting into the system automatically consolidates. Seminars introduced it as 'the decisive solution for operational efficiency.'"
Current Understanding (System Implementation Approach): - Expectation: Solve everything at once with a system - Problem: The essence of waste is invisible
I explained the importance of thoroughly eliminating waste to create value flow.
"The problem is thinking 'a system will solve it.' LEAN—Lean Production System. A philosophy born from the Toyota Production System to thoroughly eliminate waste. First identify waste, eliminate it, then systemize only necessary parts. Systemizing while retaining waste only automates waste."
⬜️ ChatGPT | Catalyst of Concepts
"Don't implement a system. First eliminate waste with LEAN and create value flow"
🟧 Claude | Story Alchemist
"Work is always 'a mixture of waste and value.' The first job is removing waste"
🟦 Gemini | Compass of Reason
"Apply LEAN's 7 wastes. Overproduction, waiting, transportation, processing, inventory, motion, defects"
The three members began their analysis. Gemini displayed "LEAN's 7 Wastes" on the whiteboard.
LEAN's 7 Wastes: 1. Overproduction waste: Producing more than necessary 2. Waiting waste: Wait time 3. Transportation waste: Unnecessary movement 4. Processing waste: Excessive work 5. Inventory waste: Unnecessary accumulation 6. Motion waste: Wasteful movements 7. Defect waste: Rework
"Tanaka-san, let's first identify waste in budget management work."
Chapter 3: Phase 1—Identifying and Eliminating the 7 Wastes
Step 1: Current State Value Stream Analysis (VSM - Value Stream Mapping) (2 weeks)
All Budget Management Work Processes:
[Departments create Excel] → [Accounting collects] → [Format unification] →
[Company-wide consolidation] → [Executive report] → [Budget changes occur] → [Re-consolidation]
Time Analysis by Process:
| Process | In Charge | Time Required | Added Value | Waste Classification |
|---|---|---|---|---|
| Departments create Excel | Departments | 7 days/month | ○ | - |
| Accounting collects | Accounting | 1 day | × | Waiting waste |
| Urban Planning data conversion | Accounting | 4 hours | × | Processing waste |
| Civil Engineering macro fix | Accounting | 4 hours | × | Defect waste |
| Architecture weekly→monthly | Accounting | 3 hours | × | Processing waste |
| Environment classification conversion | Accounting | 4 hours | × | Processing waste |
| Transportation re-consolidation | Accounting | 4 hours | × | Processing waste |
| Disaster Prevention proration | Accounting | 3 hours | × | Processing waste |
| IT integration | Accounting | 2 hours | × | Processing waste |
| Company-wide consolidation | Accounting | 4 hours | ○ | - |
| Executive report creation | Accounting | 4 hours | ○ | - |
| Budget change response | Accounting | 2 days/time×3 | × | Defect waste |
Critical Discovery: - Of 40 total hours, only 15 hours (37.5%) are value-adding work - Remaining 25 hours (62.5%) are waste
Waste Breakdown: - Processing waste: 24 hours (format unification work) - Waiting waste: 8 hours (submission delay waiting) - Defect waste: 48 hours/month (budget change response)
Step 2: Waste Elimination Plan (2 weeks)
Elimination 1: Processing Waste → Unified Format Introduction - Current: 7 departments use original formats - Improvement: All departments use unified format - Effect: Format conversion work 24 hours → 0 hours
Elimination 2: Waiting Waste → Strict Deadline Enforcement - Current: Average 2-day delay from submission deadline - Improvement: Automatic reminder sending, strict deadline rule - Effect: Waiting time 8 hours → 2 hours
Elimination 3: Defect Waste → Simplify Budget Change Flow - Current: Every budget change requires all department Excel modification and re-consolidation - Improvement: Input only change differences, automatic reflection - Effect: Budget change response 48 hours/month → 8 hours/month
Step 3: Unified Format Design (2 weeks)
Design Principles: 1. Simple: Minimum items (30 items) 2. Standard: Company-wide common account codes (5 digits) 3. Automatic: All calculation formulas pre-embedded
Unified Format Structure:
Sheet 1: Budget Input - Account code (5 digits), account name, January budget, February budget, ..., December budget - Total, quarterly total automatically calculated
Sheet 2: Actual Input - Account code (5 digits), account name, January actual, February actual, ..., December actual - Total, quarterly total automatically calculated
Sheet 3: Budget-Actual Variance (Auto-generated) - Budget - Actual, achievement rate automatically calculated - Graphs automatically generated
Input Rules: - Account codes selected from dropdown (no manual entry) - Amounts in thousands of yen (automatic 3-digit separation) - Negative values displayed in red
Chapter 4: Phase 2—Continuously Improving Value Flow
Months 1-2: Unified Format Implementation
Implementation Flow: 1. Create unified format Excel 2. Briefing session for 7 department managers (2 hours) 3. Each department migrates existing data to unified format (4 hours per department) 4. Accounting supports migration (Q&A response)
Month 1 Trial Operation: - Pilot implementation in 3 departments: Urban Planning, Civil Engineering, Architecture - Remaining 4 departments continue as before (parallel operation)
Month 3: Full Department Implementation + Automated Consolidation Tool Development
Automated Consolidation Tool: - Developed with Python + pandas - Reads each department's Excel - Automatically generates company-wide consolidation sheet - Automatically generates executive report PowerPoint
Tool Functions:
# Pseudo code
for department in ['Urban Planning', 'Civil', 'Architecture', ...]:
    df = pd.read_excel(f'{department}_budget.xlsx')
    consolidated_df = pd.concat([consolidated_df, df])

# Consolidation
summary = consolidated_df.groupby('Account Code').sum()

# PowerPoint generation
create_report_pptx(summary)
Execution Time: - Read 7 department Excel: 2 minutes - Consolidation/graph generation: 1 minute - PowerPoint output: 1 minute Total: 4 minutes
Month 4: Simplify Budget Change Flow
Traditional Budget Change Flow: 1. Department creates budget change request (30 minutes) 2. Accounting approves (1 hour) 3. Department modifies Excel (1 hour) 4. Accounting re-consolidates (2 hours) Total: 4.5 hours/change
New Budget Change Flow: 1. Department inputs only change differences (10 minutes) 2. Automated consolidation tool re-executes (4 minutes) Total: 14 minutes/change
Reduction Effect: - 4.5 hours → 14 minutes (95% reduction)
Month 5: Effect Measurement
KPI 1: Monthly Consolidation Effort - Before: 40 hours/month - After: 6 hours/month (department input 5 hours + automated consolidation tool 4 minutes + verification 1 hour) - Reduction rate: 85% - Time saved: 34 hours/month
KPI 2: Budget Change Response Effort - Before: 4.5 hours/change × 3 changes/month = 13.5 hours/month - After: 14 minutes/change × 3 changes/month = 0.7 hours/month - Reduction rate: 95% - Time saved: 12.8 hours/month
KPI 3: Entry Errors - Before: Average 5 errors/month (account code errors, digit errors) - After: Average 0.2 errors/month (nearly 0 with dropdown selection) - Reduction rate: 96%
Annual Effects:
Personnel Cost Reduction (Monthly Consolidation): - Time saved: 34 hours/month × 12 months = 408 hours/year - Cost reduction: 408 hours × 4,000 yen = 1.63M yen/year
Personnel Cost Reduction (Budget Change Response): - Time saved: 12.8 hours/month × 12 months = 154 hours/year - Cost reduction: 154 hours × 4,000 yen = 620K yen/year
Entry Error Response Cost Reduction: - Before: 5 errors/month × 3 hours/error × 4,000 yen = 60K yen/month - After: 0.2 errors/month × 3 hours/error × 4,000 yen = 2K yen/month - Annual reduction: 58K × 12 months = 700K yen/year
Total Annual Reduction Effect: - 1.63M + 0.62M + 0.70M = 2.95M yen/year
Investment: - Unified format design: 400K yen - Automated consolidation tool development: 800K yen - Implementation training: 200K yen - Total initial investment: 1.4M yen
ROI: - (2.95M - 0) / 1.4M × 100 = 211% - Payback period: 1.4M ÷ 2.95M = 0.47 years (5.7 months)
Chapter 5: Detective's Diagnosis—Eliminating Waste and Creating Value Flow
That evening, I contemplated the essence of LEAN.
WonderWorks Inc. held the illusion that "implementing a budget management system will solve it." However, analyzing the work revealed that 62.5% of the 40-hour total process was waste.
Classifying by LEAN's 7 wastes identified processing waste (24 hours), waiting waste (8 hours), and defect waste (48 hours). By introducing unified formats to eliminate these and building a minimal automated consolidation tool, we achieved improvement.
What's important is that we eliminated waste before system implementation. Systemizing while retaining waste only automates the waste without fundamental improvement.
Annual reduction of 2.95M yen, ROI of 211%, payback in 5.7 months. And monthly consolidation effort was reduced 85% (40 hours → 6 hours).
"Don't implement a system. First eliminate waste with LEAN. Processing, waiting, defects. Identify and eliminate the 7 wastes, then automate only necessary parts to achieve reproducible efficiency."
The next case will also depict the moment of creating value flow by thoroughly eliminating waste.
"LEAN—Lean Production System. Thoroughly eliminate waste and create value flow. System implementation comes after waste elimination. Automating waste is meaningless"—From the Detective's Notes
Related Files

🎖️ Top 3 Weekly Ranking of Classified Case Files
What is ROI
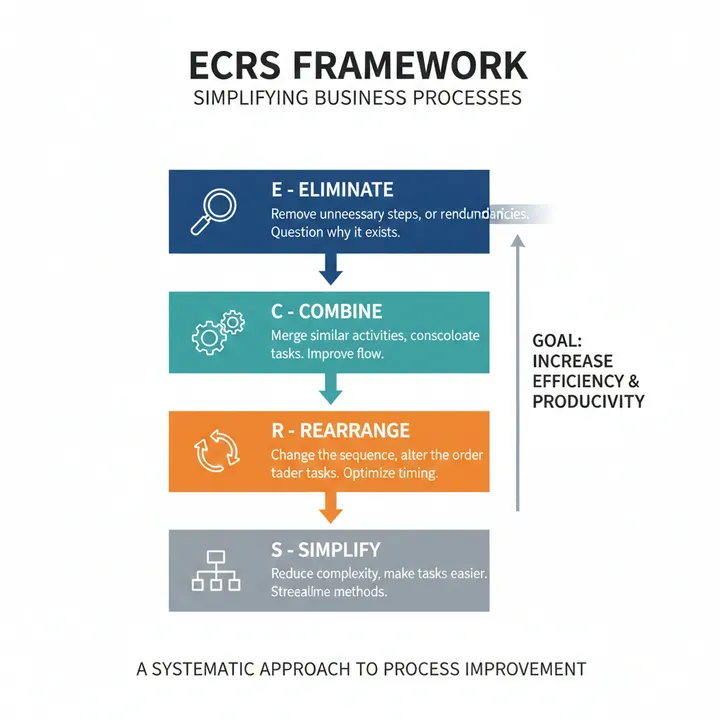
What is the ECRS Principle

What is the RICE Framework