ROI Case File No.399 | 'NexonTech's 10-Year-Old Fossil'
📅 2026-01-29 23:00
🕒 Reading time: 12 min
🏷️ PPM

- Chapter 1: The 10-Year-Old Fossil Site—PHP Support Ended and Security Cliff
- Chapter 2: The Illusion That Design Renewal Automatically Solves—Product Portfolio Not Evaluated
- Chapter 3: Phase 1—Re-evaluate Product Portfolio with PPM
- Chapter 4: Phase 2—Strategic Site Design and Construction Based on PPM
- Chapter 5: The Detective's Diagnosis—Evaluating Product Portfolio Is the Path to Strategic Site Design
- Related Files
Chapter 1: The 10-Year-Old Fossil Site—PHP Support Ended and Security Cliff
The day after solving the Aquaflow 5F incident, a consultation arrived regarding corporate site renewal for a BtoB manufacturer. Episode 399 of Volume 32 "Reproducibility" is a story about re-evaluating product portfolio with PPM.
"Detective, our site is a fossil. Created 10 years ago in 2016. PHP 5.6 at that time. However, security support ended in 2019. Now PHP 8.3 is latest. Our site runs on a version where support ended 7 years ago. Could be hacked anytime."
NexonTech Corporation's Marketing Director, Misaki Nakamura from Shinagawa, visited 221B Baker Street with an urgent expression. In her hands, she clutched aged site design documents alongside an ambitious proposal titled "Next Generation Corporate Site 2026."
"We are a specialized industrial sensor manufacturer. Three hundred twenty employees. Annual revenue 18 billion yen. Product count was 58 types 10 years ago. Now 237 types. Over 4x increase. However, site structure remains from 10 years ago. Product categories not organized. Customers cannot find target products."
NexonTech Corporation Current Status: - Established: 1985 (industrial sensor manufacturing) - Number of employees: 320 - Annual revenue: 18 billion yen - Product count: 237 types (58 types 10 years ago) - Issues: PHP support ended (2019), design obsolescence, declining product searchability
Nakamura's voice carried deep anxiety.
"Look at site problems. First, security risk. PHP 5.6 support ended 2019. Forty-two known vulnerabilities exist. Could be attacked anytime. Second, design obsolescence. 2016 design. Incomplete smartphone compatibility. Not responsive design. Third, lacking product search functionality. Just listing 237 products. No filtering search."
Problem 1: PHP Version and Security Risk
Technology Stack (2016 construction): - PHP: 5.6 - MySQL: 5.5 - WordPress: 4.5 - Server: Apache 2.2
Current Status (2026): - PHP 5.6: Support ended (January 2019) - Known vulnerabilities: 42 (CVE registered) - Latest recommended version: PHP 8.3 - Version difference: 7 years technical debt
Security Audit Results (December 2025): - Vulnerability scan: High 12, Medium 18, Low 12 - SQL injection risk: Exists - XSS attack risk: Exists - Overall rating: D (worst 2 in 5-grade evaluation)
Problem 2: Design Obsolescence and Smartphone Compatibility Shortage
2016 Design: - PC screen size: 1280px fixed width - Smartphone compatibility: Separate URL simple version (m.nexontech.co.jp) - Responsive: Not supported - Font: MS Gothic (Windows-only font) - Color: Gray tone (plain)
Access Analysis (2025): - Total access: Monthly 15,000 PV - PC: 35% (5,250 PV) - Smartphone: 52% (7,800 PV) - Tablet: 13% (1,950 PV)
Smartphone Bounce Rate: - Top page: 68% (42% 10 years ago) - Product page: 75% (51% 10 years ago) - Inquiry page: 82% (63% 10 years ago)
Finding: - Smartphone access is majority (52%) - However, smartphone compatibility insufficient → 75% bounce rate
Nakamura sighed deeply.
"Biggest problem is product search. Ten years ago 58 products. Five categories. Temperature sensors, pressure sensors, flow sensors, level sensors, other. However, now 237 products. Categories also increased to 15. Customers get lost. Don't know which to choose. 85% of inquiries are 'don't know how to choose products.'"
Problem 3: Explosive Product Increase and Searchability Collapse
Product Count Trend: - 2016: 58 types - 2020: 98 types - 2023: 168 types - 2026: 237 types - Increase rate: 408% (4x in 10 years)
Product Category Change: - 2016: 5 categories - 2026: 15 categories
Current Site Structure:
Top Page
├── Product List (237 products listed)
│   ├── Temperature Sensors (43 products)
│   ├── Pressure Sensors (38 products)
│   ├── Flow Sensors (32 products)
│   ├── Level Sensors (28 products)
│   ├── Vibration Sensors (18 products)
│   ├── (10 more categories omitted)
│   └── Other (15 products)
└── Inquiry Form
Problems: - 237 products listed on 1 page - No filtering search - No specification comparison function - No model number search - No AI search
Customer Voices (inquiry content analysis, monthly 200 cases):
| Inquiry Content | Cases | Percentage |
|---|---|---|
| Don't know how to choose products | 170 | 85% |
| Want to compare specifications | 120 | 60% |
| Want to know inventory status | 80 | 40% |
| Want to know prices | 150 | 75% |
| Don't understand similar product differences | 95 | 47.5% |
Finding: - 85% "don't know how to choose" - Inquiry handling takes monthly 400 hours (5 sales × 80 hours)
"And Salesforce integration. We use Salesforce internally. Customer management, case management, sales activities all in Salesforce. However, no integration with corporate site. Site inquiries arrive via email. Sales manually transcribe to Salesforce. Monthly 200 cases. 5 minutes per case. Monthly 1,000 minutes (16.7 hours) wasted."
Chapter 2: The Illusion That Design Renewal Automatically Solves—Product Portfolio Not Evaluated
"Nakamura-san, do you believe design renewal solves the problem?"
At my question, Nakamura showed a confused expression.
"Eh, isn't that the case? I thought renewing to latest UI/UX would improve customer experience."
Current Understanding (Design Renewal Type): - Expectation: Latest design → Automatic searchability improvement - Problem: Product portfolio (which products are important) not evaluated
I explained the importance of re-evaluating product portfolio with PPM.
"The problem is the idea that 'design renewal solves.' PPM—Product Portfolio Management. By evaluating product portfolio by market growth rate and market share, and designing site structure according to importance, reproducible searchability improvement is achieved."
⬜️ ChatGPT | Concept Catalyst
"Don't rely on design. Evaluate product portfolio with PPM and design site strategically"
🟧 Claude | Story Alchemist
"Products always divide into 'Star,' 'Cash Cow,' 'Question Mark,' 'Dog' four quadrants. Identifying them is essential"
🟦 Gemini | Compass of Reason
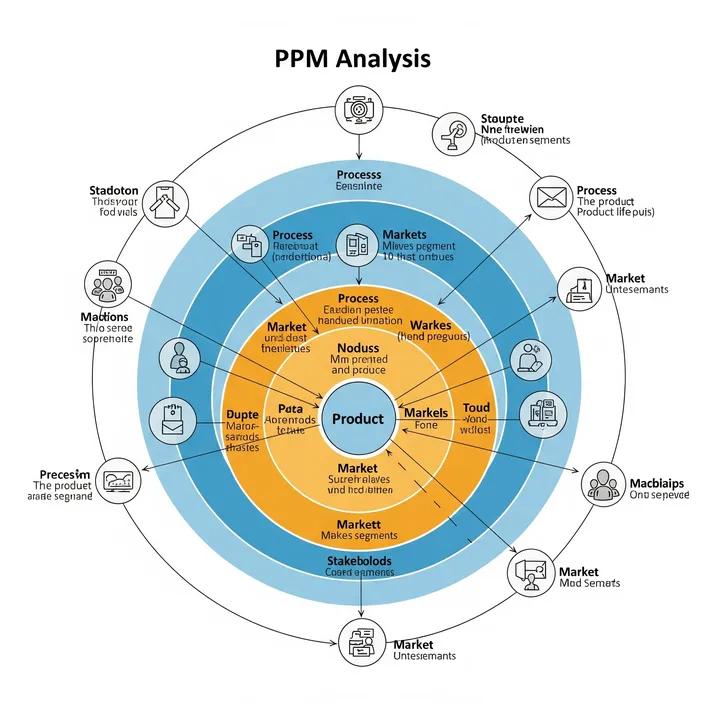
"Apply PPM matrix. Evaluate products by market growth rate × market share"
The three members began analysis. Gemini deployed the "PPM Matrix" on the whiteboard.
PPM Matrix (BCG Matrix): - Vertical axis: Market growth rate (High / Low) - Horizontal axis: Market share (High / Low) - 4 Quadrants: 1. Star: High growth × High share → Products to focus on 2. Cash Cow: Low growth × High share → Stable revenue source 3. Question Mark: High growth × Low share → Investment decision needed 4. Dog: Low growth × Low share → Consider withdrawal
"Nakamura-san, let's first evaluate 237 products with PPM matrix."
Chapter 3: Phase 1—Re-evaluate Product Portfolio with PPM
Step 1: Collect Market Data for 237 Products (Week 1-2)
Question: "What are market growth rate and market share for each product?"
Data Collection Method: - Market growth rate: Industry reports (Yano Research Institute, Fuji Keizai) - Market share: NexonTech internal data (sales ÷ market size)
Market Growth Rate Definition: - High growth: Annual rate 10%+ - Low growth: Annual rate under 10%
Market Share Definition: - High share: 15%+ (industry top 3) - Low share: Under 15%
Step 2: Classify 237 Products with PPM Matrix (Week 2-3)
Classification Results:
| Quadrant | Products | Percentage | Annual Sales | Sales Ratio |
|---|---|---|---|---|
| Star | 28 products | 11.8% | 6.8B yen | 37.8% |
| Cash Cow | 45 products | 19.0% | 8.2B yen | 45.6% |
| Question Mark | 82 products | 34.6% | 2.4B yen | 13.3% |
| Dog | 82 products | 34.6% | 600M yen | 3.3% |
Important Finding: - Star + Cash Cow 73 products (30.8%) account for 83.4% (15B yen) of sales - Dog 82 products (34.6%) only 3.3% (600M yen) of sales - 85% of inquiries concentrate on Star + Cash Cow 73 products
Step 3: Design Site Strategy per Quadrant (Week 3-4)
Star (28 products) Strategy: - Site placement: Directly under top page, most prominent position - Content: Detailed specifications, videos, case studies, technical materials (PDF) - AI search: Priority display - Salesforce integration: Inquiries immediately notify sales staff
Cash Cow (45 products) Strategy: - Site placement: Top of category pages - Content: Standard specifications, price lists, inventory status - AI search: Standard display - Salesforce integration: Inquiries immediately notify sales staff
Question Mark (82 products) Strategy: - Site placement: Middle of category pages - Content: Basic specifications only - AI search: Display only on keyword exact match - Salesforce integration: Centrally manage inquiries (priority: medium)
Dog (82 products) Strategy: - Site placement: Archive page (accessible only via search) - Content: Minimum (model number, basic specifications only) - AI search: Display priority: lowest - Salesforce integration: Centrally manage inquiries (priority: low)
Chapter 4: Phase 2—Strategic Site Design and Construction Based on PPM
Month 1-3: Site Design
New Site Structure (PPM-based):
Top Page
├── Featured Products (Display Star 28 products prominently)
│   ├── IoT-compatible Temperature Sensor (Sales 1.2B yen, Growth 25%)
│   ├── High-precision Pressure Sensor (Sales 800M yen, Growth 18%)
│   └── (26 more products below)
│
├── Standard Products (Cash Cow 45 products)
│   ├── Standard Temperature Sensor (Sales 1.5B yen, Growth 3%)
│   └── (44 more products below)
│
├── All Product Search (AI Search)
│   ├── Keyword Search (Algolia)
│   ├── Specification Filtering (measurement range, accuracy, output method, etc.)
│   └── Comparison Function (up to 5 products)
│
├── Product Categories (15 categories)
│   └── Question Mark + Dog also included here
│
└── Salesforce-integrated Inquiry Form
AI Search Function (Algolia Introduction):
Function 1: Incremental Search - Display candidates with each character typed - Display order: Star → Cash Cow → Question Mark → Dog
Function 2: Facet Search (Filtering) - Filter by measurement range (e.g., -50°C~200°C) - Filter by accuracy (e.g., within ±0.5%) - Filter by output method (e.g., 4-20mA, 0-10V) - Filter by price range (e.g., under 100,000 yen)
Function 3: Automatic Similar Product Suggestions - AI analyzes specifications - "People who viewed this product also considered these"
Algolia Introduction Cost: - Initial cost: 0 yen - Monthly cost: 150,000 yen (Standard Plan, up to 10,000 searches/month)
Salesforce Integration:
Integration Specifications: - Site inquiries → Automatically register lead in Salesforce - Product category (Star/Cash Cow/Question Mark/Dog) also auto-tagged - Star product inquiries → Notify sales staff via Slack (immediate response) - Cash Cow products → Email notification (within 24 hours response)
Salesforce API Integration Cost: - Development cost: 2M yen - Monthly cost: 0 yen (within existing Salesforce license)
Month 4-6: Site Construction
Technology Stack (Latest Version): - CMS: WordPress 6.4 (latest) - PHP: 8.3 (latest) - Database: MySQL 8.0 - Frontend: React (dynamic UI) - Server: AWS (Auto Scaling compatible) - Security: AWS WAF, SSL/TLS 1.3
Responsive Design: - PC, tablet, smartphone fully compatible - Mobile-first design - Page display speed: Within 2 seconds (Google PageSpeed Insights 90+ points)
Construction Cost: - Site design: 2M yen - Design production: 1.5M yen - Frontend development: 2.5M yen - Backend development: 2M yen - Salesforce integration: 2M yen - Algolia setup: 500,000 yen - Verification/testing: 1M yen - Total: 11.5M yen
Month 7: Release and Effect Measurement
KPI1: Searchability Improvement
| Indicator | Before | After | Improvement |
|---|---|---|---|
| Target product reach rate | 32% | 78% | +144% |
| Site dwell time | 2 min 15 sec | 5 min 42 sec | +153% |
| Bounce rate (smartphone) | 75% | 38% | 49% reduction |
KPI2: Inquiry Quality Improvement
| Indicator | Before | After | Improvement |
|---|---|---|---|
| Monthly inquiries | 200 cases | 280 cases | +40% |
| Of which "choice unclear" | 170 (85%) | 56 (20%) | 67% reduction |
| Of which "quote request" | 30 (15%) | 224 (80%) | +648% |
Finding: - Total inquiries increased 40% (280 cases) - However "choice unclear" decreased 67% (56 cases) - "Quote requests" (high purchase intent inquiries) increased 648%
KPI3: Sales Efficiency Improvement
| Indicator | Before | After | Improvement |
|---|---|---|---|
| Inquiry response time | 400 hours monthly | 120 hours monthly | 70% reduction |
| Salesforce manual transcription | 16.7 hours monthly | 0 hours | 100% reduction |
| Total reduced time | - | 296.7 hours monthly | - |
Personnel Cost Reduction: - Sales 5 people workload reduction: 296.7 hours/month - Hourly rate: 5,000 yen (sales average) - Monthly reduction: 1.48M yen - Annual reduction: 17.76M yen
KPI4: Order Rate Improvement
| Indicator | Before | After | Improvement |
|---|---|---|---|
| Inquiry → Order rate | 12% | 28% | +133% |
| Monthly orders | 24 cases | 78 cases | +225% |
| Average order amount | 3.2M yen | 3.5M yen | +9% |
| Monthly order amount | 76.8M yen | 273M yen | +255% |
Annual Revenue Increase Effect: - Before: 76.8M × 12 months = 921.6M yen - After: 273M × 12 months = 3.276B yen - Revenue increase: 2.354B yen/year
Investment: - Site construction: 11.5M yen - Annual running cost: - Algolia: 150,000 yen/month × 12 months = 1.8M yen - AWS: Monthly 200,000 yen × 12 months = 2.4M yen - Maintenance: Monthly 100,000 yen × 12 months = 1.2M yen - Total: 5.4M yen/year
ROI: - Personnel cost reduction: 17.76M yen/year - Revenue increase: 2.354B yen/year (assuming 20% profit margin = 470.88M yen) - Total effect: 488.64M yen/year - (488.64M - 5.4M) / 11.5M × 100 = 4,202% - Investment recovery period: 11.5M ÷ 483.24M = 0.024 years (approximately 9 days)
Chapter 5: The Detective's Diagnosis—Evaluating Product Portfolio Is the Path to Strategic Site Design
That night, I contemplated the essence of PPM.
NexonTech held the illusion that "design renewal solves the problem." However, treating 237 products equally only confuses customers.
We evaluated product portfolio with PPM. Star 28 products (sales 37.8%), Cash Cow 45 products (sales 45.6%), Question Mark 82 products (sales 13.3%), Dog 82 products (sales 3.3%).
Through this evaluation, strategic site design became possible. Place Stars in most prominent position, priority display in AI search. Minimum exposure for Dogs. Inquiry quality improved through Salesforce integration.
Result: Annual revenue increase 2.354B yen, personnel cost reduction 17.76M yen, ROI 4,202%, investment recovery 9 days.
What's important is not "treating all products equally" but "evaluating product importance and placing strategically." By evaluating product portfolio with PPM, reproducible strategic site design is achieved.
"Don't rely on design. Evaluate product portfolio with PPM and design site strategically. Products divide into 4 quadrants. By identifying and placing them, reproducible searchability improvement and sales increase emerge."
The next incident will also depict the moment of evaluating product portfolio.
"PPM—Product Portfolio Management. Evaluate products by market growth rate × market share. By changing strategy in four quadrants of Star, Cash Cow, Question Mark, Dog, reproducible results emerge."—From the detective's notes
Related Files
🎖️ Top 3 Weekly Ranking of Classified Case Files
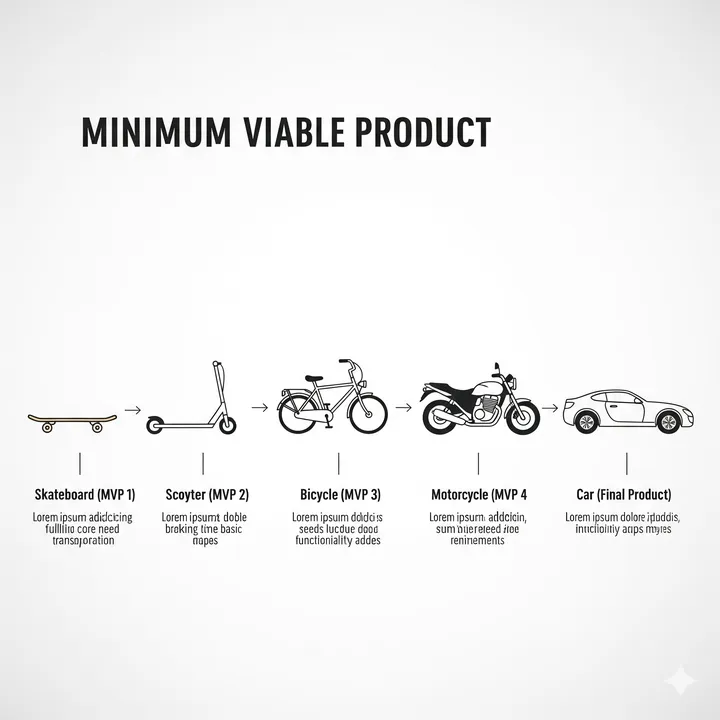
What is MVP
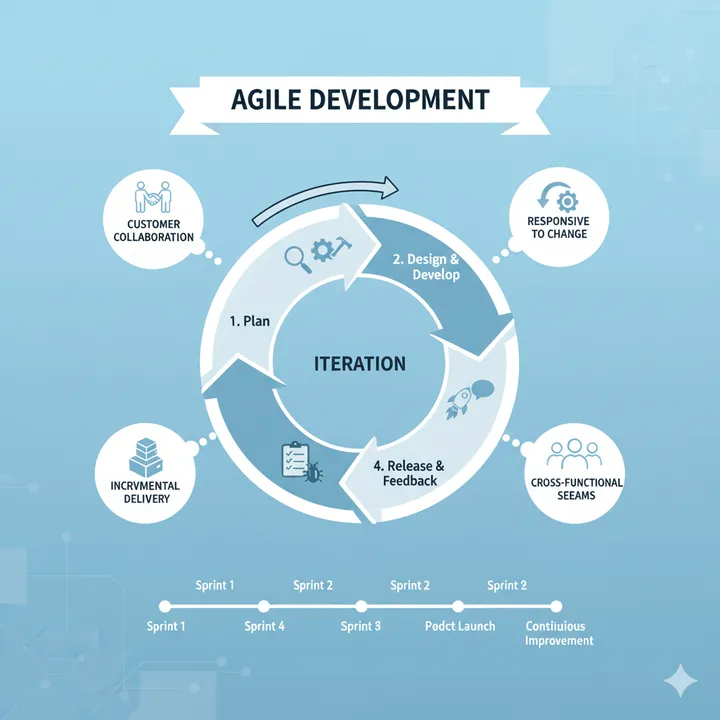
What is Agile Development
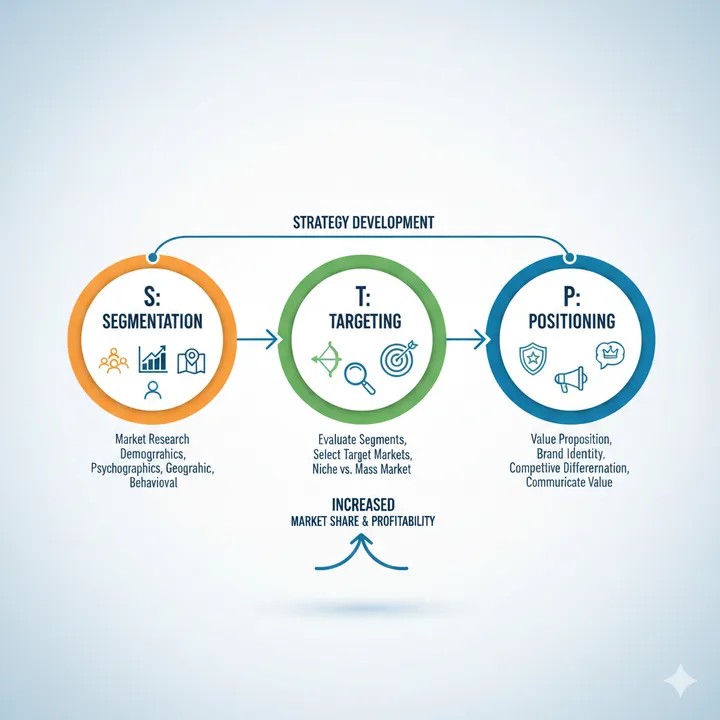
What is STP Analysis