ROI【🔏CLASSIFIED CASE FILE】 No. X022 | What is AARRR Model
📅 2025-06-22
🕒 Reading time: 9 min
🏷️ AARRR Model 🏷️ Learning 🏷️ 【🔏CLASSIFIED CASE FILE】
- What is AARRR Model - Case Overview
- Basic Structure of AARRR Model - Evidence Analysis
- AARRR Model Implementation Process - Investigation Methods
- The Power of AARRR Model - Hidden Truths
- Limitations and Cautions of AARRR Model - Potential Dangers
- Applications and Related Methods of AARRR Model - Related Case Files
- Conclusion - Investigation Summary
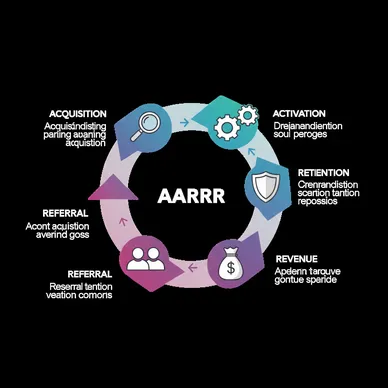
Detective's Note: A five-letter cipher chanted like an incantation in startup and growth company strategy meetings - "AARRR." This growth metrics model, formed by the initials of Acquisition, Activation, Retention, Referral, and Revenue, is affectionately known as "Pirate Metrics" and utilized worldwide as a blueprint for sustainable growth born in Silicon Valley in the late 2000s. However, reports consistently indicate that many companies are satisfied with merely "measuring five indicators," losing sight of the original purpose of building true growth engines. Why "pirate"? We must uncover the true identity of the mechanism where five stages interact to generate exponential growth.
What is AARRR Model - Case Overview
AARRR Model (Pirate Metrics) - formally known as "Pirate Metrics," a growth measurement and management framework proposed by Silicon Valley entrepreneur Dave McClure in 2007. Recognized among our clients as a methodology for achieving sustainable growth by structuring customer lifecycle into five stages: Acquisition, Activation, Retention, Referral, and Revenue, with optimization at each stage. However, in actual practice, most companies use it superficially as a "KPI classification tool," with insufficient understanding of inter-stage relationships and integrated operation as a growth engine, unable to utilize it for building truly scalable growth systems.
Investigation Memo: Growth structuring and optimization through five stages. Seemingly simple, yet behind this lies clear design philosophy: "optimization of the entire process from customer acquisition to monetization" and "sustainable growth mechanism design." We must uncover why these five stages and the mechanism where synergy among stages generates exponential growth.
Basic Structure of AARRR Model - Evidence Analysis
Primary Evidence: The Five Stages of AARRR
Acquisition - Customer Acquisition
"Stage of attracting potential customers to your service"
・New user acquisition
・Website visits, app downloads
・Member registration, sign-ups
・Lead generation, prospect creation

Key Metrics:
・Visitor count, download numbers
・Registration count, lead numbers
・Conversion rates by acquisition channel
・Customer Acquisition Cost (CAC)
Activation - First Experience
"Stage of having users experience value in their first use"
・User onboarding
・First use and experience
・Value realization, Aha! moment
・Basic feature mastery

Key Metrics:
・Activation rate
・First use completion rate
・Onboarding completion rate
・Time to first value realization
・Feature usage and mastery rates
Retention - Continued Usage
"Stage of maintaining continuous usage"
・Regular usage and engagement
・Habit formation and routine usage
・Deep feature utilization
・Long-term relationship building

Key Metrics:
・Retention rates (Day1, Day7, Day30, Monthly)
・Monthly Active Users (MAU)
・Usage frequency, session duration
・Feature usage depth and breadth
・Churn rate
Referral - Word-of-Mouth Expansion
"Stage where existing users bring in new users"
・Recommendations to friends and acquaintances
・Word-of-mouth and review posting
・Social sharing
・Referral program utilization

Key Metrics:
・Referral rate, Net Promoter Score (NPS)
・Viral coefficient, K-factor
・New acquisitions through referrals
・Word-of-mouth and review counts
・Social share numbers
Revenue - Monetization
"Stage of generating revenue"
・Upgrades to paid plans
・Additional service and feature purchases
・Recurring billing and subscriptions
・Long-term customer value maximization

Key Metrics:
・Monthly Recurring Revenue (MRR)
・Customer Lifetime Value (LTV)
・Average Order Value (AOV)
・Upsell and cross-sell rates
・Revenue growth rate
Evidence Analysis: The brilliance of AARRR Model lies in clearly showing optimization points according to customer growth stages, with a circular structure where each stage becomes the foundation for the next. Particularly, the growth engine design where Retention generates Referral, which connects to new Acquisition, is embedded.
AARRR Model Implementation Process - Investigation Methods
Investigation Discovery 1: Concrete AARRR Analysis Example (Online Learning Platform)
Case Evidence (Programming Learning Service):

Acquisition:
Current: 1,000 new monthly registrations
Channel breakdown:
・SEO/Organic search: 40% (400 users)
・Social media ads: 30% (300 users)
・Referrals and word-of-mouth: 20% (200 users)
・Others: 10% (100 users)
CAC: $50/user
Challenges: Rising acquisition costs, need for channel diversification

Activation:
Current: 30% first course completion rate among registrants
Detailed metrics:
・Profile setup completion: 80%
・First lesson start: 60%
・First course completion: 30%
・Mentor consultation usage: 15%
Challenges: High onboarding dropout rate

Retention:
Current: Retention rate progression
・Day1: 70%, Day7: 40%, Day30: 20%
・3-month retention: 10%, 6-month retention: 5%
Monthly Active Users: 2,000
Challenges: Medium to long-term retention improvement

Referral:
Current: 5% referral rate among existing users
NPS (Net Promoter Score): +20
Referral program usage rate: 2%
Review and word-of-mouth posting rate: 3%
Challenges: Viral effect enhancement

Revenue:
Current: $50,000 monthly revenue
Paid plan conversion rate: 8%
Average LTV: $200
LTV/CAC ratio: 4.0
Challenges: Profitability improvement, plan conversion rate enhancement
Investigation Discovery 2: Growth Bottleneck Identification and Improvement Strategy
Stage-wise Improvement Priorities:

Top Priority: Activation Improvement
・30% activation rate below industry average
・Fundamental onboarding experience improvement
・Time reduction to first value realization
・Personalized learning path provision

Next Priority: Retention Strengthening
・Day30 retention rate of 20% has major improvement potential
・Learning habit formation mechanism construction
・Progress visualization and achievement recognition
・Community feature enhancement

Medium Priority: Referral Promotion
・High satisfaction but doesn't translate to referral behavior
・Referral incentive review
・Shareable features and content
・Achievement and progress visualization/sharing features

Post-improvement Target Values:
・Activation: 30% → 50%
・Day30 Retention: 20% → 35%
・Referral Rate: 5% → 15%
・Paid Conversion: 8% → 12%
Investigation Discovery 3: Implementation Steps
Step 1: Current State Measurement and Baseline Setting
・Current indicator measurement for each stage
・Funnel analysis and cohort analysis
・Benchmark and target value setting
・Measurement system and dashboard construction

Step 2: Bottleneck Identification and Prioritization
・Identification of stages with highest improvement impact
・Evaluation of improvement potential and execution difficulty
・ROI calculation
・Initiative roadmap formulation

Step 3: Experiment and Improvement Initiative Execution
・A/B testing and prototype validation
・Staged improvement and continuous optimization
・Cross-functional team formation
・High-speed [PDCA](/behind_case_files/articles/X003_PDCA) and agile execution

Step 4: Effect Measurement, Learning, and Reflection
・Quantitative measurement of initiative effects
・User feedback collection
・Success and failure factor analysis
・Learning reflection for next initiatives

Step 5: Growth Engine Development and Scaling
・Standardization and automation of success patterns
・Growth engine construction and operation
・Organizational structure and process development
・Continuous growth systematization
The Power of AARRR Model - Hidden Truths
Alert File 1: Growth Structuring and Optimization Structures intuitive "growth strategy" into five clear stages, enabling scientific optimization at each stage. Clarifies bottlenecks and investment priorities.
Alert File 2: Sustainable Growth Engine Construction Designs self-reinforcing growth mechanisms where retention and referrals generate new acquisitions, rather than temporary growth. Achieves transition from external dependency to inherent growth capability.
Alert File 3: Data-Driven Management Foundation Converts decision-making from intuition and experience to objective data-based judgment through quantitative indicators at each stage. Promotes investment effect measurement and continuous improvement.
Alert File 4: Organization-wide Growth Focus Enables coordination among marketing, product, customer success, sales departments through common growth indicators. Achieves transition from departmental optimization to overall optimization.
Limitations and Cautions of AARRR Model - Potential Dangers
Alert File 1: Metric Measurement Becomes Purpose Most frequent problem. Cases where measuring and reporting five indicators becomes the goal, failing to connect to actual growth initiatives or improvement actions. Risk of satisfaction with number management.
Alert File 2: Independent Stage Optimization Cases of optimizing each stage individually, losing sight of inter-stage relationships and overall optimization. For example, ignoring trade-offs where increased acquisitions lead to decreased activation rates, causing overall deterioration.
Alert File 3: Short-term Indicator Bias Risk where attention concentrates on easily measurable short-term indicators (acquisition numbers), while long-term value creation (retention, revenue) is neglected. Risk of prioritizing temporary number improvements over sustainable growth.
Alert File 4: Uniform Application to Business Models Risk of uniformly applying AARRR to different business models (B2B, B2C, subscription, e-commerce) while ignoring industry and product characteristics, leading to inappropriate analysis.
Alert File 5: Qualitative Element Neglect Tendency to overemphasize quantitative indicators while neglecting qualitative elements like customer satisfaction, brand value, competitive relationships. Risk of overlooking important elements difficult to quantify.
Applications and Related Methods of AARRR Model - Related Case Files
Related Evidence 1: Integration with Customer Journey Map
Journey Map (Experience Design) × AARRR (Growth Measurement):
・Linking customer experience and indicators at each stage
・Simultaneous achievement of experience improvement and growth indicator enhancement
・Integrated analysis of qualitative experience and quantitative results
・Customer-centric growth strategy planning
Related Evidence 2: Combination with RFM Analysis
AARRR (Growth Stages) × [RFM](/behind_case_files/articles/X014_RFM) (Customer Value):
・[RFM](/behind_case_files/articles/X014_RFM) segment analysis at each growth stage
・High-value customer behavior pattern identification
・Segment-specific optimization strategies
・Efficient customer development and monetization
Related Evidence 3: Coordination with BSC and KPI Management
AARRR → BSC Integration:
・Incorporation of growth indicators into strategic objectives
・Coordination with departmental KPIs
・Organization-wide growth focus
・Continuous growth management system
Related Evidence 4: Integration with Lean Startup
Build-Measure-Learn × AARRR:
・Hypothesis validation cycles at each stage
・MVP development and growth indicator coordination
・Optimization through high-speed experimentation and learning
・Evidence-based growth strategy
Related Evidence 5: Coordination with Growth Hacking
・Data-driven growth initiative planning
・Cross-functional growth teams
・Experiment-driven continuous improvement
・Scalable growth system construction
Conclusion - Investigation Summary
Final Investigator Report:
AARRR Model represents "a navigation chart for sustainable growth," and as its nickname "Pirate Metrics" indicates, it's a strategic framework combining adventurous spirit for pioneering unknown growth territories with scientific methodology. The growth structuring through five stages—Acquisition, Activation, Retention, Referral, and Revenue—possesses the power to convert intuitive startup management into data-driven sustainable growth systems.
The most impressive aspect of this investigation was the excellence of AARRR Model's "growth engine design." Beyond a mere metric measurement tool, it clearly designs self-reinforcing growth mechanisms where continued usage generates word-of-mouth, which connects to new customer acquisition. This enables transition from growth dependent on external marketing budgets to sustainable expansion through inherent growth capability.
The effect of achieving organization-wide growth focus was also an important discovery. Previously departmentally optimized activities in marketing, product, customer success, sales are integrated through common growth indicators, enabling overall optimal growth strategy execution.
However, the trap many companies fall into—"metric measurement becomes the purpose"—also emerged clearly. Cases frequently occur where satisfaction with measuring and reporting five indicators fails to connect to actual growth initiatives or improvement actions. AARRR's true value lies not in "measuring" but in "achieving actual growth through continuous optimization at each stage."
Integrated utilization with other customer understanding and strategic analysis methods was also an important discovery. Combining experience design through Customer Journey Map, customer value analysis through RFM analysis, and strategic KPI management through BSC enables construction of more comprehensive and effective growth systems.
The potential for evolution in the digital age is also significant. More advanced and automated AARRR operations using new technologies like real-time analysis, AI prediction, and automatic optimization become possible.
The most important discovery is that AARRR Model functions beyond a "measurement tool" as a "growth culture development system." It possesses the power to foster organizational culture necessary for sustainable growth: data-driven growth thinking, experiment-driven improvement culture, customer-centric value creation. This represents the true power of these pirate metrics.
Sustainable Growth Maxim: "True growth means building mechanisms where customers' value realization naturally calls the next customers, and this circulation continues to expand."
Case Closed