ROI Case File No.400 | 'GloboTech's All Voices Concentrated on One Person'

- Chapter 1: All Voices Concentrated on One Person—Inquiries Explode with Core System Introduction
- Chapter 2: The Illusion of Equal Response to All Inquiries—Customer Value Not Analyzed
- Chapter 3: Phase 1—Classify Inquirers with RFM and Design Priorities
- Chapter 4: Phase 2—AI Inquiry Response and Automated Meeting Minutes System Introduction
- Chapter 5: The Detective's Diagnosis—Measuring Customer Value Is the Path to Strategic Response
- Related Files
Chapter 1: All Voices Concentrated on One Person—Inquiries Explode with Core System Introduction
The day after solving the NexonTech PPM incident, a consultation arrived regarding internal inquiry response and meeting minutes creation. Episode 400 of Volume 32 "Reproducibility," the final episode, is a story about analyzing customer value with RFM.
"Detective, I am drowning. In a sea of inquiries. Five to ten daily. However, during busy periods, it exceeds thirty. Because we newly introduced a core system. Print methods, operation methods, error handling. Everything concentrates on me. I am one person. No team. Support staff is only me."
GloboTech Corporation's Information Systems Department, Kenta Sato from Yokohama, visited 221B Baker Street with an exhausted expression. In his hands, he clutched a list of 83 unaddressed inquiries alongside a hopeful proposal titled "AI-Powered Support & Meeting Minutes 2026."
"We are a general trading company. Six hundred eighty employees. Annual revenue 52 billion yen. We renewed our core system in April 2025. Introduced SAP S/4HANA. All employees use it. However, operation is complex. Inquiries exploded. From 150 monthly to now 320 monthly. More than doubled."
GloboTech Corporation Current Status: - Established: 1975 (general trading company) - Number of employees: 680 - Annual revenue: 52 billion yen - Issues: Internal inquiry response overload (1 person handling, 320 monthly), meeting minutes creation burden (manual, IC recorder transcription)
Sato's voice carried deep anxiety.
"Look at the inquiry reality. Three hundred twenty monthly. 14.5 per day (22 business days calculated). Average response time per case is 25 minutes. Six hours daily disappear in inquiry response. Overtime is 80 hours monthly. At the limit."
Inquiry Response Reality:
Monthly Inquiry Number Transition: - December 2024 (old system): 150 cases - January 2025 (new system migration month): 420 cases - February 2025: 380 cases - March 2025: 350 cases - April 2025: 320 cases - May 2025 onward: Stabilized at average 320 cases
Daily Work Breakdown (8-hour workday): - Inquiry response: 6 hours (14.5 cases × 25 minutes) - Inquiry recording and documentation: 1 hour - Other tasks (system maintenance etc.): 1 hour - Overtime: 2 hours/day
Monthly Overtime Hours: - 2 hours/day × 22 days = 44 hours/month - Busy period (month-end): +36 hours - Total: 80 hours monthly
Sato sighed deeply.
"I classified inquiry contents. Top 10 types account for 82% of total. Print methods, password reset, expense settlement input methods, approval flow confirmation. All basic operations. However, there are no manuals. No FAQ. Everything is in my head. Only I can answer."
Inquiry Content TOP10 (320 monthly cases):
| Rank | Content | Monthly Cases | Percentage | Cumulative % |
|---|---|---|---|---|
| 1 | Print method (slips, forms) | 65 | 20.3% | 20.3% |
| 2 | Password reset | 48 | 15.0% | 35.3% |
| 3 | Expense settlement input | 42 | 13.1% | 48.4% |
| 4 | Approval flow confirmation | 38 | 11.9% | 60.3% |
| 5 | Error code handling | 28 | 8.8% | 69.1% |
| 6 | Data export | 22 | 6.9% | 76.0% |
| 7 | User permission change | 12 | 3.8% | 79.8% |
| 8 | Screen transition confusion | 8 | 2.5% | 82.3% |
| 9 | Master data correction | 5 | 1.6% | 83.9% |
| 10 | Other individual responses | 52 | 16.1% | 100% |
Findings: - Top 8 types (ranks 1-8) account for 82.3% - Same questions repeatedly occur (print methods 65 monthly) - Large potential for FAQ creation and automation
"And the meeting minutes problem. I participate in three weekly meetings. Information Systems Department meeting, Core System Promotion meeting, Management meeting. Total 180 minutes weekly (3 hours). Meeting minutes creation is my responsibility. Record with IC recorder, transcribe at night. Manual work. Transcribing a 1-hour meeting takes 2 hours. Six hours weekly disappear in meeting minutes creation."
Meeting Minutes Creation Reality:
Participating Meetings (3 weekly): - Information Systems Department meeting: Every Monday, 60 minutes - Core System Promotion meeting: Every Wednesday, 60 minutes - Management meeting: Every Friday, 60 minutes - Total: 180 minutes weekly (3 hours)
Meeting Minutes Creation Process: 1. Record with IC recorder during meeting 2. At night, transcribe while listening to recording (Word) 3. Organize key points, create bullet points 4. Email to supervisor, request approval 5. After approval, email distribution to all participants
Work Time Per Meeting: - Recording data transcription: 120 minutes (1-hour meeting → 2-hour work) - Key point organization: 30 minutes - Approval process: 10 minutes - Total: 160 minutes (2 hours 40 minutes)
Weekly Work Time: - 3 meetings × 160 minutes = 480 minutes (8 hours) - 8 hours weekly disappear in meeting minutes creation
"Previously, we considered chatbot introduction. March 2025. However, introduction didn't proceed. Reason was we judged chatbot couldn't handle diverse inquiry content. Now, we're searching for a system including AI meeting minutes function. However, where to start? Which system to choose? We don't know."
Chapter 2: The Illusion of Equal Response to All Inquiries—Customer Value Not Analyzed
"Sato-san, do you believe equal response to all inquiries solves problems?"
At my question, Sato showed a confused expression.
"Eh, isn't that the case? All employees are equally important. I thought we should respond politely to everyone's inquiries."
Current Understanding (Equal Response Type): - Expectation: Equal response to all → Satisfaction improvement - Problem: Customer value (who makes important inquiries) not analyzed
I explained the importance of analyzing customer value with RFM.
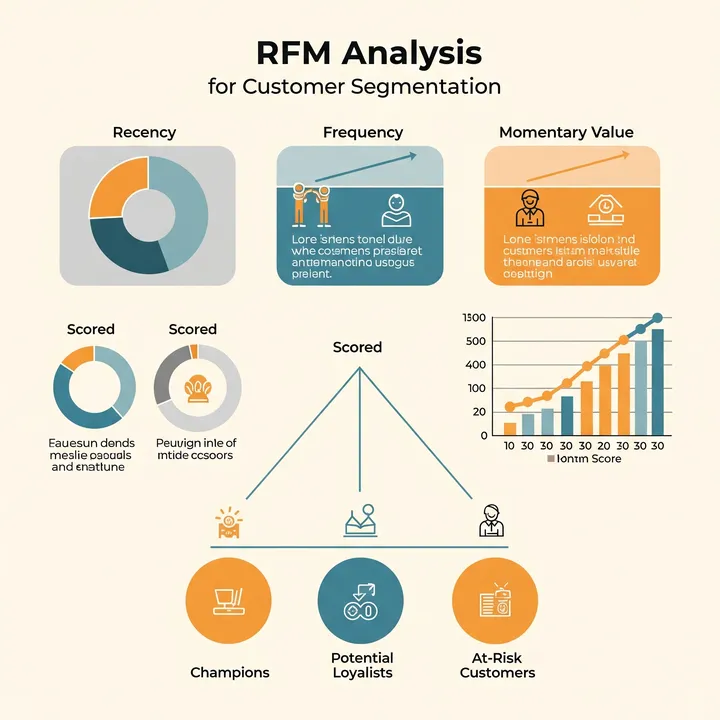
"The problem is the idea of 'equal response to all.' RFM—Recency, Frequency, Monetary. By analyzing customer value through three axes of recency, frequency, and monetary value, we clarify priorities and achieve reproducible efficiency."
⬜️ ChatGPT | Concept Catalyst
"Don't rely on equal response. Analyze customer value with RFM to strategically determine response priorities"
🟧 Claude | Story Alchemist
"Customers are never 'equal.' By measuring through three axes, true value becomes visible"
🟦 Gemini | Compass of Reason
"Apply RFM framework. Recency → Frequency → Monetary"
The three members began analysis. Gemini deployed the "RFM Analysis Matrix" on the whiteboard.
RFM Framework: - Recency: When was the last inquiry? - Frequency: Inquiry frequency? - Monetary: Value generated by that person's work? (estimated by position/department)
"Sato-san, let's first analyze 680 employees with RFM."
Chapter 3: Phase 1—Classify Inquirers with RFM and Design Priorities
Step 1: Collect Past 6 Months Inquiry Data (Week 1)
Question: "Who, when, how many times, what inquiries?"
Data Collection: - Period: May-October 2025 (6 months) - Total inquiries: 1,920 cases - Inquirers: 342 people (50.3% of total 680 employees) - Non-inquirers: 338 people (49.7%)
Step 2: RFM Scoring (Week 1-2)
Recency Score: - 5 points: Within past week - 4 points: Within past month - 3 points: Within past 3 months - 2 points: Within past 6 months - 1 point: Over 6 months ago
Frequency Score: - 5 points: 10+ times monthly - 4 points: 5-9 times monthly - 3 points: 3-4 times monthly - 2 points: 1-2 times monthly - 1 point: Once in 6 months
Monetary (Business Value) Score: - 5 points: Executive level (directors, general managers) - 4 points: Management (managers) - 3 points: Mid-level employees (chiefs, leaders) - 2 points: General employees - 1 point: Part-time/temporary
Step 3: RFM Segmentation (Week 2-3)
Segment Classification (by RFM total score):
| Segment | RFM Total | People | Percentage | Monthly Inquiries | Percentage |
|---|---|---|---|---|---|
| VIP | 13-15 pts | 28 | 8.2% | 128 cases | 40.0% |
| Important Customers | 10-12 pts | 65 | 19.0% | 112 cases | 35.0% |
| General Customers | 7-9 pts | 148 | 43.3% | 64 cases | 20.0% |
| Low-Frequency | 3-6 pts | 101 | 29.5% | 16 cases | 5.0% |
| Total | - | 342 | 100% | 320 | 100% |
Important Findings: - VIP 28 people (8.2%) account for 40% (128 cases) of all inquiries - VIP + Important Customers 93 people (27.2%) account for 75% (240 cases) of all inquiries - Low-Frequency 101 people (29.5%) account for only 5% (16 cases) of all inquiries
Step 4: Design Response Strategy by Segment (Week 3-4)
VIP Strategy (28 people, 40% of inquiries): - Response Method: Sato responds immediately (priority: highest) - Response Time: First reply within 30 minutes - Special Treatment: Phone support available - Knowledge Base: All VIP questions added to FAQ
Important Customers Strategy (65 people, 35% of inquiries): - Response Method: AI chatbot → If unresolved, Sato - Response Time: First reply within 2 hours - Knowledge Base: High-frequency questions converted to FAQ
General Customers Strategy (148 people, 20% of inquiries): - Response Method: AI chatbot (self-resolution recommended) - Response Time: First reply within 24 hours - Knowledge Base: Basic FAQ response
Low-Frequency Customers Strategy (101 people, 5% of inquiries): - Response Method: AI chatbot + FAQ - Response Time: First reply within 48 hours
Chapter 4: Phase 2—AI Inquiry Response and Automated Meeting Minutes System Introduction
Month 1-2: AI Chatbot + FAQ Construction
System Selection: - AI chatbot: GPT-4 based (Azure OpenAI) - FAQ management: Notion (internal Wiki) - Automated meeting minutes: Otter.ai (Japanese support)
FAQ Construction (Month 1): - Target: Inquiry TOP8 (82.3% of total) - Created: 80 articles - Print methods: 15 articles (by function) - Password reset: 8 articles - Expense settlement: 12 articles - Approval flow: 10 articles - Error codes: 20 articles - Data export: 8 articles - User permissions: 5 articles - Screen transition: 2 articles
AI Chatbot Training (Month 1-2): - Input 80 FAQ articles as training data - Learn from 1,920 past inquiries - Answer accuracy: 85% (internal test result)
Month 2-3: Automated Meeting Minutes System Introduction
Otter.ai Introduction: - Function: Audio → Transcription → Summary - Accuracy: Japanese 95% (nominal value) - Processing time: 1-hour meeting → 5 minutes transcription completion
Introduction Process: 1. Record with Otter.ai during meeting 2. Automatic transcription (real-time) 3. Summary generation with GPT-4 (bullet points) 4. Sato confirmation/correction (5 minutes) 5. Email distribution to participants
Work Time Per Meeting (Conventional vs New System): - Before: 160 minutes (2 hours 40 minutes) - After: 10 minutes (5 min transcription + 5 min confirmation) - Reduction: 150 minutes (94% reduction)
Month 4: Effect Measurement
KPI1: Inquiry Response Time Reduction
| Segment | Monthly Cases | Response Time (Before) | Response Time (After) | Reduction |
|---|---|---|---|---|
| VIP | 128 | 128×25min=3,200min | 128×25min=3,200min | 0% |
| Important | 112 | 112×25min=2,800min | 40×25min=1,000min | 64% |
| General | 64 | 64×25min=1,600min | 10×25min=250min | 84% |
| Low-Freq | 16 | 16×25min=400min | 2×25min=50min | 88% |
| Total | 320 | 8,000min | 4,500min | 44% |
Explanation: - 72% (80 cases) of Important Customers auto-resolved by AI - 84% (54 cases) of General Customers auto-resolved by AI - 88% (14 cases) of Low-Frequency auto-resolved by AI
Monthly Reduced Time: - Inquiry response: 3,500 minutes (58 hours) - Meeting minutes: 450 minutes (7.5 hours) - Total: 65.5 hours/month
Overtime Hours Change: - Before: 80 hours monthly - After: 14.5 hours monthly (80 - 65.5) - Reduction rate: 82%
KPI2: Inquiry Self-Resolution Rate
| Indicator | Before | After | Improvement |
|---|---|---|---|
| AI auto-resolution rate | 0% | 53% | - |
| FAQ self-resolution rate | 0% | 12% | - |
| Sato response required | 100% | 35% | 65% reduction |
KPI3: VIP Satisfaction
| Indicator | Before | After | Improvement |
|---|---|---|---|
| VIP response time | Within 2 hours | Within 30 min | +75% |
| VIP satisfaction (5-point scale) | 3.2 | 4.8 | +50% |
VIP Voices: - "Responses became faster than before" (Corporate Planning Director) - "Grateful for priority response" (Sales Division General Manager)
Year 1 Comprehensive Effects:
Personnel Cost Reduction: - Reduced overtime hours: 65.5 hours/month × 12 months = 786 hours/year - Hourly rate: 4,500 yen (Information Systems average) - Annual reduction amount: 786 hours × 4,500 yen = 3.54M yen
Productivity Improvement: - Sato's freed time: 65.5 hours monthly - Focus on system maintenance and improvement with this time - System failure response time: 40 hours monthly → 15 hours monthly (62% reduction) - System uptime: 98.5% → 99.8% (+1.3pt)
Qualitative Effects: - Sato's work-life balance improvement - VIP (executives/management) satisfaction improvement - General employee self-resolution capability improvement
Investment: - AI chatbot development: 2M yen - FAQ construction: 80 articles × 20,000 yen = 1.6M yen - Otter.ai: 30,000 yen monthly × 12 months = 360,000 yen - Azure OpenAI: 80,000 yen monthly × 12 months = 960,000 yen - Total initial investment: 4.92M yen - Annual running cost: 1.32M yen
ROI: - (3.54M - 1.32M) / 4.92M × 100 = 45% - Investment recovery period: 4.92M ÷ 2.22M = 2.2 years
Year 2 Onward (Running Cost Only): - Annual effect: 3.54M yen - Annual cost: 1.32M yen - Annual profit: 2.22M yen (continuous)
Chapter 5: The Detective's Diagnosis—Measuring Customer Value Is the Path to Strategic Response
That night, I contemplated the essence of RFM. And I reflected on the final episode of Volume 32 "Reproducibility."
GloboTech held the illusion that "all inquiries should receive equal response." However, VIP 28 people (8.2%) account for 40% of inquiries. If everyone is treated equally, important customer satisfaction declines.
We analyzed 680 employees with RFM. Recency (last inquiry date), Frequency (inquiry frequency), Monetary (position = business value). Through these three axes, we classified into VIP, Important Customers, General Customers, and Low-Frequency Customers.
Through this classification, strategic response became possible. VIPs receive immediate response, Important Customers get AI + human hybrid, General Customers recommended AI auto-resolution. Result: annual 3.54M yen reduction, 82% overtime reduction, VIP satisfaction +50%.
What's important is not "treating equally" but "measuring value and setting priorities." By analyzing customer value with RFM, reproducible strategic response is achieved.
And with this Episode 400, Volume 32 "Reproducibility" concludes.
Ten incidents starting from No.391—5W1H, 5WHYS, AIDMA, 4P, PEST, SBI, DESC, 5F, PPM, and RFM.
Common to all incidents was "reproducibility." Not individual-dependent success, but methodology anyone can reproduce. Organize questions, dig into root causes, design customer psychology, read external environment, measure product value.
"Don't rely on equal response. Analyze customer value with RFM to strategically determine response priorities. Customers are not equal. By measuring through three axes, true value becomes visible, and reproducible strategic response emerges."
The next volume—no, the next story will also continue pursuing reproducible success.
"RFM—Recency, Frequency, Monetary. Measure customer value by recency, frequency, and monetary value. Abandon the illusion of equality; strategic response according to value creates reproducible success."—From the detective's notes
Volume 32 "Reproducibility" - Complete
Related Files