ROI Case File No.444 'What the Chart Cannot Say'

What the Chart Cannot Say
Chapter 1: The Image Folder Where Lab Results Sleep
"To compare a patient's blood work against past results, I have to open three separate image files and reconcile them in my head."
Alisa Ramos, Operations Director at Medico Innovations, said this while showing us her computer screen. The EMR interface for the company's seven clinics across Thailand and the Philippines displayed patient test results as JPEG thumbnail images arranged in a row.
"The current system is provided by a Hong Kong vendor. It worked fine when we started, but as the clinics grew, the limits became clear. Especially —" Alisa continued. "Physicians fill out charts in completely different ways. One doctor writes long narrative notes, another leaves fields nearly empty. The fields are too unstructured to standardize the information."
"The Hong Kong clinic is closing, you mentioned?" I confirmed.
"The contract review is due in May. At the same time, we're planning a new opening in Manila, so migrating to a new system is urgent."
"What about from the staff side?" Claude asked.
"Reception staff are most frustrated with billing. The clinical records and billing system aren't integrated, so after each appointment they manually retype everything. Fifty appointments a day means fifty re-entries."
I set my notebook down. The problem wasn't which system to replace this one with — it was the question "whose experience, and which part of it, needs to improve?"
Chapter 2: Design That Begins With Empathy
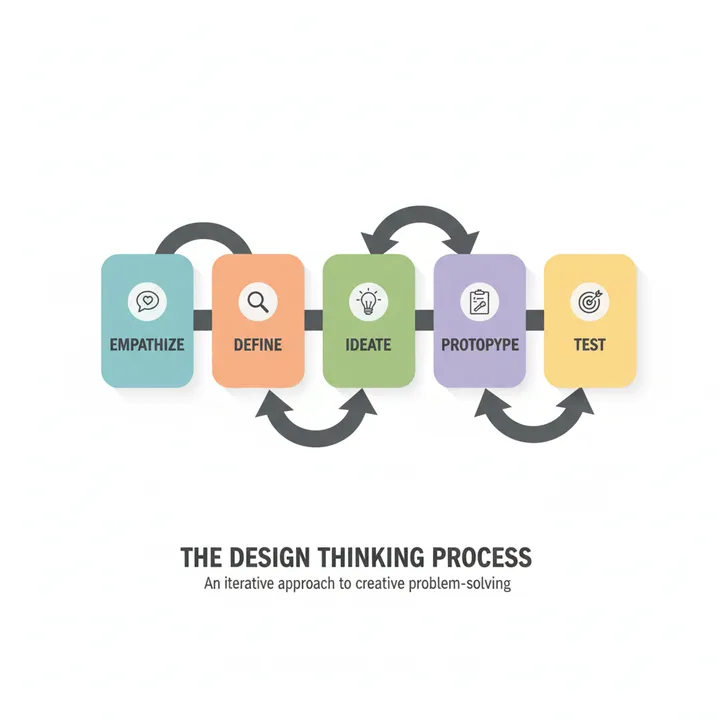
"This case calls for Design Thinking."
Claude drew five stages across the whiteboard. Empathize, Define, Ideate, Prototype, Test — with an arrow pointing right.
"The essence of Design Thinking," I began, "is deeply understanding the user's experience before thinking about solutions. In an EMR replacement, there are at least three types of users: physicians, nurses and staff, and patients. Visualizing where each of these three groups experiences friction is the starting point for system requirements."
[Empathize: Find the moment the finger stops]
"Let's start by structuring staff voices with KOE-Score," Gemini suggested.
Alisa entered pre-collected staff interview notes into the tool, and a distribution of concerns was visualized. The most common feedback was not "I can't figure out where to input things" — it was "I don't feel like what I input is being used."
"This is an important finding," Claude noted. "Staff aren't exhausted by the complexity of the operations. They're exhausted by the lack of any sense that the data they enter is contributing to the quality of care."
"From the physician's perspective," I continued, "the real problem with test results stored as image files isn't that comparison analysis is impossible. It's that being unable to grasp a patient's trajectory at a glance degrades both the accuracy and the speed of the consultation."
[Define: Condense three groups' friction into one question]
"We narrow the voices from the empathy phase to a single question," Gemini continued. "Physicians: the moment they open a chart, they can't see how the patient's condition has changed. Staff: the data they enter isn't flowing into the work around them. Patients: they're asked the same questions every time."
"The question that runs through all three," Claude summarized, "is a structural problem: 'information is dying where it's born.' A design where entered data doesn't trigger the next action is generating friction for physicians, staff, and patients in different but connected ways."
"The core of the system requirements," I concluded, "is not specifications. It's connectivity — the moment data is entered, someone else's job gets easier. That is the essential function this system needs."
[Ideate and Prototype]
"In this phase," Gemini proposed, "select two candidate systems and run a comparative test by entering the same patient case in both. Evaluate on four axes: chronological display of test results, standardization of physician charting, automatic linkage from consultation to billing, and data-sharing speed across multiple locations."
"What matters," Claude emphasized, "is having the most frustrated staff members run the test, not the IT team. The evaluator of a system should be the person who suffers most from the current one."
[Test: Three months, one location]
"Finally, the test phase," I continued. "Select one location and run a three-month trial, measuring five KPIs: average charting time per consultation, billing re-entry error rate, staff overtime hours, physician satisfaction score, and the number of times patients are asked for the same information twice."
"With those five numbers," Gemini added, "an ROI calculation becomes possible. Enter them into ROI Proposal Generator and it will auto-generate a payback projection and executive proposal."
Chapter 3: So the Physician's Fingers Keep Moving
Alisa studied the five stages on the whiteboard.
"I was only thinking about comparing system specifications. But what I realized today is that what we wanted to solve wasn't a technology problem — it was a human experience problem."
"The core of Design Thinking," I replied, "is making empathy with the user's experience the starting point of the design process. Start from functional requirements and you build a system nobody uses. Start from empathy and you build a system the floor refuses to give up."
"Spending time in the empathy phase," Claude added, "might feel like a detour to management. But the cost of a system chosen without listening to users — when it fails to take root on the floor — is tens of times greater than the time spent on empathy."
Alisa nodded. "Next week, I'll ask every staff member and physician across all locations the same question: where does your finger stop most?"
Chapter 4: The Day Data Reaches the Next Pair of Hands
Six months later, a report arrived from Alisa.
The system selected through the five stages of Design Thinking passed a three-month trial at the Philippine location and was fully deployed across all seven clinics.
Average charting time per consultation dropped from fourteen minutes to eight. Billing re-entry errors fell to zero. The most dramatic change was staff overtime: from a monthly average of twenty-two hours before migration to seven hours after.
But the change Alisa described most proudly was not a number. "Last week, one staff member came to me on their own and said — entering data doesn't feel like a burden anymore. They said it's because they can see the doctor using what they entered during consultations."
What the chart could not say had finally started reaching the next pair of hands.
"Replacing an EMR is an act of changing medicine. But starting from a comparison of system specs means only the screen changes. What Design Thinking asks is: whose fingers are stopping? Design born from empathy creates a chain — where staff find meaning in entering data, physicians don't need to look away from the screen, and patients stop being asked the same questions twice. The justification for the investment is not proved by the spec sheet. It is proved by the fingers on the floor."
Related Files
Tools Used
- KOE-Score — Structures and visualizes staff voices
- ROI Proposal Generator — Generates payback projections and proposal documents from trial data


