ROI【🔏Classified File】 No. X053 | What is ROAS
- What is ROAS - Case Overview
- Basic Structure of ROAS - Evidence Analysis
- ROAS Practice Investigation Methods - Implementation Techniques
- True Power of ROAS - Application Evidence
- ROAS Limitations and Three Pitfalls - Warnings
- Related Case Files - Measurement Systems
- Industry-Specific ROAS Benchmarks - Actual Data
- Investigation Summary - The Essence of ROAS
Detective's Memo: In the modern era where digital advertising has become a colossal market exceeding $470 billion annually, many companies are trapped in the illusion that "advertising equals sales." Yet what true detectives focus on is a cold, hard number—the "revenue per dollar of ad spend"—ROAS (Return On Advertising Spend). Why is Company A, spending $10,000 monthly on Google Ads with a 300% ROAS, profitable, while Company B, spending $1,000 with a 150% ROAS, operates at a loss? Why does Amazon continue advertising certain products even at a 50% ROAS? And why can the triumphant report of "500% ROAS achieved!" actually become a trap leading to business crisis? Hidden within this seemingly simple efficiency metric are three concealed variables: profit margin, LTV, and strategic intent. The critical difference from ROI, the trap of industry benchmark values, and the distortion in judgment created by measurement baselines—uncover the true nature of detective techniques that expose advertising investment reality through numbers.
What is ROAS - Case Overview
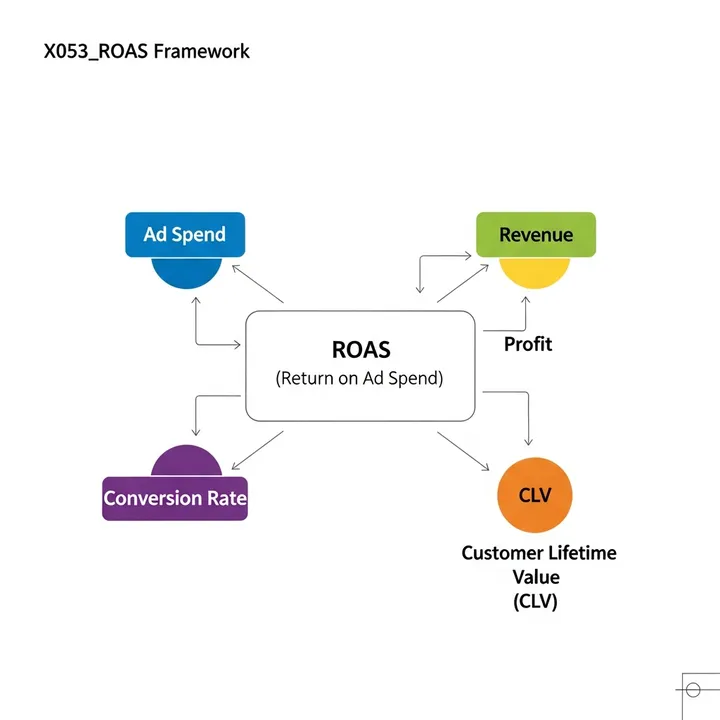
ROAS (Return On Advertising Spend), formally recognized as the "advertising cost-effectiveness indicator," is a measurement methodology standardly employed in the digital marketing industry. Through the simple calculation of "revenue attributed to advertising ÷ advertising cost," it serves as a metric indicating the revenue amount generated per dollar of advertising investment among clients. However, in actual practice, the simplistic understanding that "high ROAS is good" dominates, and surface-level optimization without consideration of profit margins, customer lifetime value (LTV), or strategic intent continues to cause cases where short-term numerical improvements lead to long-term revenue deterioration.
Investigation Memo: Why is a 300% ROAS considered "good," and who determined this judgment criterion? The answer—no one did. The phantom of industry average values, incomplete comparison targets called competitors, and most dangerously, the myopic measurement of "month-over-month" comparisons. The essence of ROAS is "relative measurement of advertising efficiency," not absolute quality. The danger of blindly trusting metrics without established measurement baselines, and the same trap lurking here as the limitations of single metrics like NPS.
Basic Structure of ROAS - Evidence Analysis
Basic Evidence: Complex meaning hidden in a simple formula
ROAS Calculation Fundamentals
Basic Formula:
ROAS = Revenue from Advertising ÷ Advertising Cost × 100(%)

Example 1:
Ad Spend: $1,000
Revenue: $3,000
ROAS = $3,000 ÷ $1,000 × 100 = 300%

Interpretation: $3 in revenue generated per $1 of ad spend
Percentage vs. Multiplier Notation:
ROAS 300% = ROAS 3x = $3 revenue per $1 spent

Industry Conventions:
- Japan: Percentage notation dominant (300%)
- Western markets: Multiplier notation also common (3x)
- Google Ads: Percentage notation
- Facebook Ads: Percentage notation

This Report: Adopts percentage notation
Break-Even Point Calculation:
ROAS Break-Even Point = 100% ÷ Gross Margin

Example:
Product with 30% gross margin
→ ROAS Break-Even = 100% ÷ 0.3 = 333%

Meaning: Only profitable above 333% ROAS

Critical Discovery:
200% ROAS can still be unprofitable
100% ROAS can still be profitable
→ Judgment changes depending on gross margin
The Critical Difference Between ROAS and ROI
ROAS (Advertising Cost-Effectiveness):
ROAS = Revenue ÷ Ad Spend

Example:
Ad Spend: $10,000
Revenue: $50,000
ROAS = 500%

What it measures: Revenue efficiency
ROI (Return on Investment):
ROI = (Revenue - Total Cost) ÷ Total Cost × 100

Example:
Ad Spend: $10,000
Revenue: $50,000
COGS: $30,000
Other Costs: $5,000
Total Cost: $45,000

ROI = ($50,000 - $45,000) ÷ $45,000 × 100
    = 11.1%

What it measures: Profit efficiency
Same Revenue, Different ROAS and ROI:
Case A: Low-Margin Product
Revenue: $50,000
Ad Spend: $10,000
COGS: $40,000 (20% margin)
ROAS: 500% (high)
Profit: $0
ROI: -100% (loss)

Case B: High-Margin Product
Revenue: $50,000
Ad Spend: $10,000
COGS: $10,000 (80% margin)
ROAS: 500% (same)
Profit: $30,000
ROI: 150% (profitable)
Evidence Analysis: ROAS measures "revenue generation efficiency" but does not measure "profit generation." Without understanding this critical difference, optimizing for ROAS leads to the paradoxical failure of increasing revenue while decreasing profit.
Three Traps in ROAS Measurement
Trap 1: The Attribution Problem
Actual Customer Journey:
1. Visits site via Google Search Ad (click)
2. Leaves
3. Returns via Instagram Ad (click)
4. Leaves
5. Visits directly via URL and purchases

Which ad gets credit?
- Last Click: Instagram Ad
- First Click: Google Search Ad
- Even Distribution: 50% to each

Attribution model can cause
ROAS to vary by 2x
Trap 2: Measurement Window Setting
Product A: 1-day consideration period (daily goods)
Product B: 30-day consideration period (high-ticket item)

7-day ROAS measurement:
Product A: Accurately measured
Product B: Significantly underestimated

→ Measurement period must align
  with product characteristics
Trap 3: Brand Advertising Evaluation
Search Ad "[Company Brand Name]":
ROAS: 1000% (very high)

Reason:
Customers already aware of brand
search by brand name and purchase
→ Might have purchased without ad

True advertising effect is unclear
ROAS Practice Investigation Methods - Implementation Techniques
Investigation Finding 1: Reality of Industry-Specific ROAS Benchmarks
E-commerce Company Case Study
Background: - Monthly ad spend: $50,000 - Average product price: $50 - Gross margin: 40% - Repeat purchase rate: 30%
Phase 1: Initial State (ROAS Blind Faith Period)
Goal Setting:
"ROAS 400% or higher"

Tactics:
- Concentrate ads on high-ROAS products
- Stop ads for low-ROAS products
- Set automated bidding to "Maximize ROAS"

Results (after 3 months):
ROAS: 300% → 450% (goal achieved!)
Revenue: $200,000 → $225,000
Ad Spend: $50,000 → $50,000

However...
Profit: $30,000 → $20,000 (deteriorated)
What Happened:
Reality of High-ROAS Products:
- Repeat purchases by existing customers
- Already brand-aware audience
- Likely would have purchased without ads

Reality of Low-ROAS Products:
- New customer acquisition
- Low initial purchase value
- But high LTV

Impact of Stopping Ads:
New customer acquisition halted
→ Dependence on existing customers only
→ Medium to long-term revenue decline
Phase 2: Strategic ROAS Design
Metric Redefinition:
1. New Customer ROAS Target: 200%
   (Initial loss acceptable, recover via LTV)

2. Repeat Customer ROAS Target: 600%
   (Relationship established, high efficiency)

3. Brand Advertising ROAS: Reference value
   (Difficult to measure effect, strategic investment)

Tactics:
- Revive and strengthen new customer ads
- Bidding strategy by customer segment
- Build LTV measurement system

Results (after 6 months):
Overall ROAS: 350% (seemingly decreased)
New Customers: 150% increase
Profit: $20,000 → $50,000 (major improvement)
Investigation Finding 2: Amazon's Strategic Low-ROAS Operation
Case Evidence (Intentional ROAS Reduction)
Strategic Core:
Product Category A:
Bestseller products
Gross Margin: 20%
ROAS Target: 400% (strict)
→ Purpose: Secure profit

Product Category B:
New/Strategic products
Gross Margin: 50%
ROAS Target: 100% (low)
→ Purpose: Capture market share

Objective:
Dominate market with Category B
→ Increase brand awareness
→ Boost Category A sales
→ Maximize overall profit
Reason for Continuing Ads at 100% ROAS:
Short-term Perspective: Loss
Ad Spend: $10,000
Revenue: $10,000
Gross Profit: $5,000
After Ad Cost: -$5,000 (loss)

Long-term Perspective: Strategic Investment
1. Market share acquisition
2. Review accumulation
3. Search ranking improvement
4. Organic search traffic increase
5. Reduced ad dependency
6. Long-term profit security
Measurement Framework:
KPI Design:
- Short-term: ROAS (reference value)
- Medium-term: Market share, review count
- Long-term: Category-wide profit margin

Decision Criterion:
"Can revenue be maintained 6 months later
 even with 50% ad spend reduction?"
True Power of ROAS - Application Evidence
Power 1: Standardization of Ad Channel Comparison
Google Search Ads:
Ad Spend: $10,000
Revenue: $40,000
ROAS: 400%

Facebook Ads:
Ad Spend: $5,000
Revenue: $15,000
ROAS: 300%

Instagram Ads:
Ad Spend: $3,000
Revenue: $12,000
ROAS: 400%

Apparent Conclusion:
Google = Instagram > Facebook

But Customer Attribute Analysis:
Google: 70% existing customers (repeat)
Facebook: 80% new customers (acquisition)
Instagram: 60% new customers

True Evaluation:
Facebook: Highest new customer efficiency
→ Should consider increasing investment
Power 2: Real-Time Optimization
Automated Bidding Strategy Setting:
Target ROAS: 350%

Machine Learning Optimization:
- Bid adjustment by time of day
- Distribution ratio by device
- Budget allocation by audience

Effect (after 30 days):
Manual Operation: ROAS 280%
Auto-Optimization: ROAS 360%

Critical Insight:
Machine learning discovers and utilizes
patterns humans miss
Power 3: Scientific Budget Allocation
Monthly Budget: $30,000

Pre-Allocation:
Even distribution: $10,000 per channel

Post-Allocation (ROAS-based):
High ROAS: $15,000 (ROAS 500%)
Medium ROAS: $10,000 (ROAS 300%)
Low ROAS: $5,000 (ROAS 150%)

However, Strategic Adjustment:
New Acquisition Channel: +$3,000
→ Short-term ROAS decreases but
   LTV consideration increases long-term profit
ROAS Limitations and Three Pitfalls - Warnings
Limitation 1: Profit Invisibility
Dangerous Case:
ROAS 500% achieved
Revenue: $500,000
Ad Spend: $100,000

However:
COGS: $450,000 (10% margin)
Gross Profit: $50,000
Ad Spend: $100,000
Net Profit: -$50,000 (loss)

High ROAS but unprofitable
Limitation 2: LTV Ignorance
Product A (one-time purchase):
Initial ROAS: 400%
LTV: Initial purchase only
→ Appears superior

Product B (subscription):
Initial ROAS: 150%
LTV: 5x initial purchase
→ Appears inferior

But True Value:
Product B is overwhelmingly more profitable
Limitation 3: Brand Value Immeasurability
Brand Advertising:
No direct clicks or purchases
→ ROAS measurement impossible

Yet Effects:
- Increased brand awareness
- More branded searches
- Increased direct traffic
- Improved ROAS of other ads

Cannot judge by ROAS alone
Caution: The Optimization Trap
Machine Learning Auto-Optimization:
"Maximize ROAS" setting

Result:
- Delivers only to guaranteed customers
- Stops new customer exploration
- Market contraction and aging

"Optimization" becomes "myopization"
Related Case Files - Measurement Systems
X028_RCD (Record, Compare, Decide) Periodic ROAS recording enables comparison of initiative effectiveness and decision-making foundation.
X036_MVP (Minimum Viable Product) ROAS measurement with minimal ad budget enables effect validation before large-scale investment.
X041_BOM (Baseline of Measurement) Establishing proprietary ROAS benchmarks based on industry and product characteristics builds appropriate judgment criteria.
X040_NPS (Net Promoter Score) Strategy balancing new customer acquisition through ROAS optimization with existing customer retention through NPS improvement.
Industry-Specific ROAS Benchmarks - Actual Data
E-commerce:
Target ROAS: 300-500%
Reason: 20-40% margin typical
Note: Varies significantly by product category
SaaS:
Target ROAS: 100-300% (first month)
LTV Focus: Initial month loss acceptable
Measurement Period: Evaluate over 12-24 months
Lead Generation:
Target ROAS: Not set
Alternative Metric: CPA (Cost Per Acquisition)
Reason: Revenue doesn't occur at ad point
App Marketing:
Target ROAS: 150-400%
Measurement: Post-install monetization
LTV: Especially emphasized (subscription models)
Investigation Summary - The Essence of ROAS
ROAS is a "thermometer for advertising efficiency." Just as a thermometer showing high fever doesn't reveal whether it's a cold or post-exercise, a 500% ROAS cannot be judged as "excellent" or "missed opportunity" without the context of gross margin, LTV, and strategic intent.
True detectives don't just look at numbers. They analyze comprehensively: the background from which numbers emerged, the assumptions of measurement methods, and elements not reflected in numbers—only this leads to truth.
ROAS is a starting point, not a destination. The deep insights that begin from this metric are what separate success from failure in advertising investment.
Final Memo: ROAS without measurement baselines is like a thermometer without markings. Not the phantom of industry averages, but setting proprietary benchmarks calculated backward from your own gross margin, LTV, and strategy—this is the true essence of ROAS utilization.