ROI Case File No.483 'Two Days When the Factory Stops'

Two Days When the Factory Stops
Chapter One: The Day 170 People Count in Unison
"Twice a year, the factory stops completely."
John Smith, CEO of GlobalTech Solutions, lined up photos of the factory on the desk. Unmanned production lines, all employees scattered across the wide floor, clipboards in hand.
"It's inventory count," John continued. "All 170 employees spend a full day counting every item in the warehouse and on the production lines by hand. To prevent double-counting, pairs count the same location twice. It sometimes takes a day and a half."
"Do you have a production management system?" Claude confirmed.
"An in-house developed system runs," John answered. "But what it records is theoretical inventory. Purchase orders, receiving, shipping, and production consumption are tracked. But where in the factory what is stored, and how many, isn't tracked. A gap between theoretical and actual inventory always emerges."
"How large is the gap?" Gemini asked.
"The most recent count showed an ¥8 million gap between theoretical and actual in monetary terms," John answered. "¥4 million in excess inventory, ¥4 million in shortfall. The net difference is near zero, but location and quantity don't match."
"What's the impact of the shortfall?" I confirmed.
"The most painful case is when we promise immediate delivery based on system inventory, then can't find the physical item," John answered. "We return to the production line to remake it, or ship emergency stock from another factory—either way, it produces delivery delay to the customer. Last year we had four such cases. One nearly cost us a long-term customer."
"You're looking at FY2027 for action, you mentioned?" Claude confirmed.
"I want to raise it during the 2026 mid-term plan review," John answered. "But simple inventory-count efficiency doesn't move the executive team. Unless the proposal changes the fundamental structure of inventory management, it won't reach the investment decision threshold."
"Let's talk about fundamental structure," I said.
Chapter Two: The Constraint TOC Demands You Identify
"This case needs TOC."
Claude wrote three letters on the whiteboard. T, O, C.
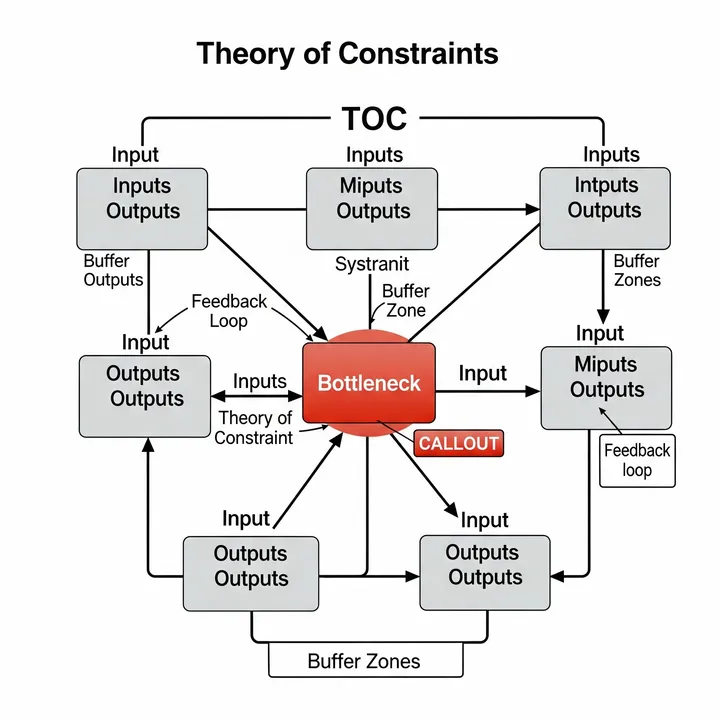
"TOC stands for Theory of Constraints," I explained. "The idea that an organization's overall performance is determined by its weakest process—the constraint. Rather than improving everything uniformly, you identify and intensively improve the constraint. For multi-process problems like inventory management, unless you identify the real bottleneck, investment disperses and effect doesn't materialize."
"Let's measure current cost," Gemini said, opening ROI Polygraph. John's count records and inventory-gap data went in.
"Semiannual cost is out," Gemini read. "Factory-stop opportunity loss during counting—a day and a half of lost manufacturing gross margin back-calculated from monthly average—is ¥6.5 million per event. Count labor for 170 people across a day and a half is 2,040 hours at ¥2,800/hour for ¥5.71 million. Excess inventory holding cost from gap is ¥960,000 annually; delay-response cost from shortfall is ¥1.2 million annually. Direct semiannual cost plus apportioned annual cost: ¥13.28 million per six months. Annualized: ¥26.56 million."
John let out a long breath. "I was counting count labor, but opportunity loss adds a whole digit."
"So, let's design with TOC," I continued.
[TOC Step One—Identify the Constraint]
"First, identify the real bottleneck," Claude said. "Is it the time spent counting, or the fact that actual inventory location is never visualized day-to-day?"
"I thought it was the time spent counting," John answered.
"Wrong," I responded. "Counting is a symptom. The bottleneck is that day-to-day actual inventory location isn't recorded. That's why once every six months, you have no choice but to count everything at once. Misidentify the constraint and you only optimize the count. The count gets faster, but the gap keeps appearing every day."
"If location were visualized, the count itself would become unnecessary," John said quietly.
"That's the answer TOC's first step gives you," Claude continued.
[TOC Step Two—Exploit the Constraint]
"Within current scope, identify what's possible," Gemini continued. "Add a mechanism to record inventory movement. Mandate RFID tag or barcode scanning at intake and dispatch. This alone dramatically closes the gap between theoretical and actual at semiannual end. Investment stays minimal while reducing the gap's source."
[TOC Step Three—Subordinate Everything to the Constraint]
"Reorganize business flow around improving the constraint," Claude said. "At production consumption, at finished-goods warehouse receipt, and at dispatch—make scanning mandatory at these three points. Design the system so next-process can't proceed without a scan. Enforce recording through structural flow, not individual attention."
"I'm worried the operation won't hold up," John said.
"Introduce in stages," I answered. "Start with one line. A three-month test period confirms field adaptation and irons out issues before expanding. Sudden company-wide rollout causes field pushback that hollows out the policy."
[TOC Step Four—Elevate the Constraint]
"Once recording is established, shrink the count itself in stages," Gemini continued. "Move from semiannual total-stop count to monthly partial counts. Eventually, since actual inventory is always visible in the system, counts become only sampling inspections."
[TOC Step Five—Move to the Next Constraint]
"Once one constraint is resolved, the next appears," Claude said. "For example, once actual inventory becomes visible, inventory optimization—excess reduction, proper order-quantity review—emerges as the next challenge. TOC isn't a one-time framework; it cycles continuously."
"Let's simulate with ROI Proposal Generator," Gemini suggested.
- Initial cost: RFID tags, barcode scanners, integration development, field training totaling ¥18 million
- Monthly cost: Tag consumables and system maintenance ¥450,000/month
- Monthly savings: Count labor reduction—¥5.71M per half equals ~¥950,000/month equivalent. Opportunity loss reduction—¥6.5M per half equals ~¥1.08M/month equivalent. Inventory gap cost reduction ¥180,000/month. Total ¥2.21M/month
- Net monthly savings: ¥2.21M − ¥450,000 = ¥1.76M
- Payback period: ¥18M ÷ ¥1.76M ≈ 10.2 months
"Just over a year for payback, then ¥21 million in annual net savings from year two," Gemini summarized. "Additionally, delivery-delay risk decreases structurally. The value of not losing a nearly-lost customer is hard to quantify."
John studied the figures. "Payback within a year for FY2027—that's a number the executive committee will approve."
Chapter Three: Toward a Proposal for the Mid-Term Plan
"Let me organize the approach," I said at the whiteboard.
"Phase one—May to August 2026. Detailed analysis of current business flow and RFP preparation for vendor selection. Phase two—September to November 2026. Pilot introduction on one line. Phase three—December 2026 to March 2027. Pilot evaluation and company-wide rollout planning. Phase four—April to September 2027. Company-wide rollout. Phase five—October 2027 onward. Phased shrinkage of the count regime."
"Will we make the mid-term plan review timing?" John confirmed.
"You will," Gemini answered. "At the July–August mid-term plan review, you'll have detailed analysis and RFP drafts ready, pre-pilot. For the executive decision material, that's sufficient."
John wrote something in his notebook. "Semiannual count has been a given. Today may have been the moment to question the given."
Chapter Four: A Factory That Doesn't Count
Thirteen months later, a report from John arrived.
Within three months of the April 2027 pilot launch, the gap between actual and theoretical inventory on the target line shrank to one-eighth of the prior level in monetary terms. Scan adherence reached 98%. "The structure where you can't proceed without scanning worked," John wrote.
Company-wide rollout completed in September. The first "no total-stop" count took place in November. A day-and-a-half of work became two hours of sampling per department. The image of 170 people stopping the factory to count became a thing of the past.
Delivery-delay incidents dropped from four per year pre-switch to zero in the most recent twelve months. The customer nearly lost last year reported, "Your delivery precision has gone up," and began discussing expanded business. John's report continued, "Because inventory location became visible, the way we sell also changed."
At the final report meeting, the factory manager reportedly said, "It's a little lonely without the semiannual count. But none of the staff say so."
A day when the constraint changed, and daily life changed with it.
"The image of 170 people counting in unison twice a year wasn't proof of effort—it was proof of a constraint. What TOC asks isn't where to improve, but where the constraint is. Speeding up the count doesn't stop the gap from appearing daily. The constraint was not in the work but in the structure that didn't record daily. What RFID and barcodes filled wasn't a gap in inventory management but the invisible distance that stretched between theoretical and actual. A factory that doesn't count was also a factory that doesn't stop."
Related Files
Tools Used
- ROI Polygraph — Visualizing count labor, opportunity loss, and inventory gap cost
- ROI Proposal Generator — Inventory management system payback simulation


