ROI Case File No.508 'The Assembly Workers Who Walked to the Tablet'

The Assembly Workers Who Walked to the Tablet
Chapter One: Walking, Entering, Returning
"Workers interrupt their work and walk to the tablet."
Naohiro Joda, Production Management Manager at AeroTech, showed us the factory walk-path map. An air-conditioner assembly line. After each step, the worker walks to the tablet beside the line and manually enters work details. "Three minutes per round trip on average. Twenty times per person per day. That's over an hour per person per day of non-work time."
"What's being entered?" Claude asked.
"Step completion time, defect occurrence, time required," Joda answered. "But it's self-reported. Some enter shorter than actual; some enter longer. We can't eliminate the subjectivity of the data. Equipment-side machine data can be auto-captured, but manual-work performance data alone has low accuracy."
"What about quality inspection?" I asked.
"Full visual inspection," Joda answered. "Five inspectors check before shipment. It relies on experience and carries miss-rate risk. Visual fatigue degrades accuracy too. Both assembly quality and inspection quality depend on people."
"Does this affect HR evaluation?" Gemini asked.
"Directly," Joda answered. "Assembly worker evaluation is based on productivity and quality. Because the data is subjective, the fairness of evaluation is being questioned. Excellent workers aren't being rewarded; average workers are being overrated—if that continues, floor morale will drop."
"Both the data capture method and the evaluation axis need rework," I replied. "Let's redesign with RFM."
Chapter Two: RFM Asks—A Three-Axis Worker Profile
"This case calls for RFM."
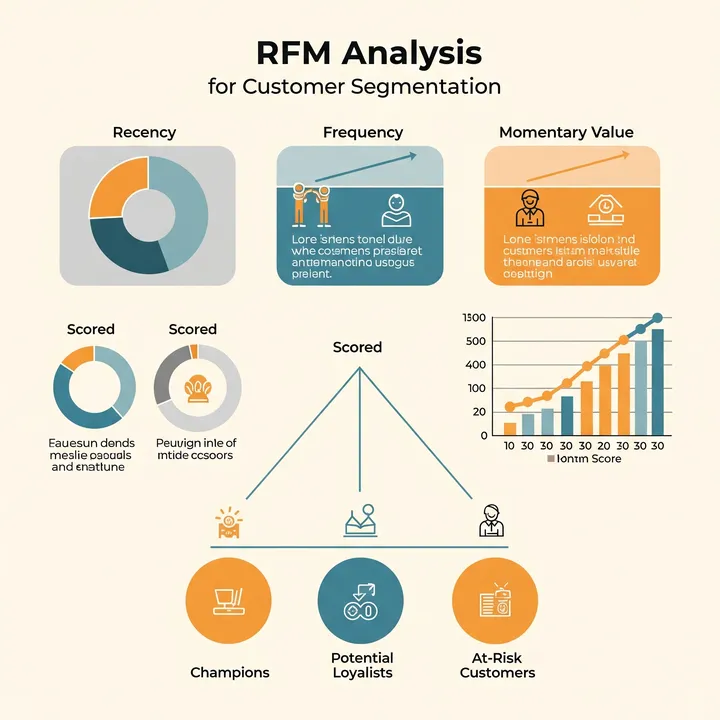
Claude wrote three letters on the whiteboard. R, F, M.
"RFM stands for Recency, Frequency, Monetary—a customer analysis method on three axes," I explained. "It comes from marketing, but it also applies to worker evaluation on the factory floor. Reread Recency as 'stability of recent work accuracy,' Frequency as 'work frequency and continuity,' and Monetary as 'added value per piece of work'—and contributions become visible in three dimensions. We design evaluation on these three axes, after automating the data capture."
"First, let's measure the current cost," Gemini said, opening ROI Polygraph. He input the data Joda provided.
"The monthly management cost has come out," Gemini read. "Tablet-entry round-trip loss across thirty workers totals 600 hours per month at 2,800 yen per hour, or 1.68 million yen monthly. Decision errors from low productivity-analysis accuracy due to subjective data average 600,000 yen monthly. Visual fatigue in quality inspection leads to missed defects flowing to market—claims and returns—costing 800,000 yen monthly. Visual inspection labor by five inspectors averages 400 hours per month at 3,200 yen per hour, or 1.28 million yen monthly. Attrition risk from evaluation-fairness concerns has an expected value of 400,000 yen monthly. Total: 4.76 million yen monthly. Annualized: approximately 57.1 million yen."
Joda looked at the figures. "Just the entry round trips are 1.68 million yen monthly. Invisible to us."
"Now let's design with RFM," I continued.
[Automating Data Capture—Setting the Premise]
"First, automate data capture," Claude said. "Install AI cameras in the work area to automatically recognize worker movement and step progression. Retire the tablet entry and eliminate movement. Simultaneously introduce AI cameras at the inspection step to automate first-pass quality judgment. Final judgment stays with inspectors, but the AI sees everything without fatigue, so miss rates structurally drop."
"How do we use the captured data?" Joda confirmed.
"For evaluation, on the three RFM axes," I replied. "Auto-capture is the premise. Evaluation design is the topic."
[R—Recency: Stability of Recent Accuracy]
"On Recency, measure stability of recent work accuracy," Gemini continued. "Not a single excellent score but the variance in work quality over the past four weeks. Distinguish workers who steadily produce high quality from those with swings. Recency-weighted evaluation more easily reflects improvement effort."
[F—Frequency: Work Frequency and Continuity]
"On Frequency, measure work volume and continuity," I continued. "Not a simple work count but a difficulty-weighted work frequency. Doing many easy steps doesn't equate to handling difficult ones. The Frequency score is difficulty-adjusted volume."
[M—Monetary: Added Value Per Piece]
"On Monetary, measure added value per piece of work," Claude continued. "Defect-rate lowness, impact on downstream steps, rework occurrence—an integrated added-value score. High productivity but high defect rate drives Monetary lower. It's quality and quantity together."
[Integrating Three Axes and Designing Evaluation]
"Integrate the three axes," Gemini continued. "Score each on five levels for a 15-point composite. Each worker's strong and weak axis is visible at a glance. Development tracks differentiate by axis: low Recency calls for stability training; low Monetary calls for quality-awareness training; low Frequency calls for reassignment to higher-difficulty steps. Evaluation becomes individually optimized."
[Estimating the Payback]
"Let's run it through ROI Proposal Generator," Gemini proposed.
- Initial cost: 7.8 million yen (AI cameras at assembly and inspection, integrated data platform, RFM scoring algorithm, HR evaluation redesign, training)
- Monthly cost: 200,000 yen (AI camera operation and analytics combined)
- Monthly savings: tablet round-trip reduction = 1.2 million yen (70% reduction assumed); decision-error reduction from accurate data = 420,000 yen; missed-defect reduction = 560,000 yen; inspector labor reduction = 770,000 yen (60% reduction assumed); attrition risk reduction from fairer evaluation = 250,000 yen. Total: 3.2 million yen monthly
- Net monthly savings: 3.2 million − 200,000 = 3 million yen
- Payback period: 7.8 million yen ÷ 3 million yen ≈ 2.6 months
"Under three months," Gemini summarized. "Critically, evaluation fairness is technically guaranteed. We don't re-collect the data—we change how the data is captured. There's no room for subjectivity to enter."
Joda looked at the numbers. "I'd thought AI cameras were a productivity-improvement conversation. Paired with evaluation design, the meaning is different."
"Data capture is a premise. What you measure determines value," I replied.
Chapter Three: Three-Axis Design and Operation
"Here's the implementation plan," I said, standing at the whiteboard.
"Months 1–2: select AI cameras, design installation positions, deploy at both assembly and inspection. Month 3: data capture testing, recognition accuracy tuning. Month 4: design the RFM scoring algorithm, validate on historical data. Month 5: HR evaluation redesign discussions, labor-management agreement. Month 6: pilot the new evaluation, collect feedback. Month 7: production rollout, switch visual inspection to AI-assisted. Month 8 onward: establish a quarterly evaluation cycle."
"Labor-management agreement matters," Joda confirmed.
"Buy-in from the floor determines success when evaluation changes," Claude replied. "Both the data capture method and the evaluation axes are explained to workers in advance. The RFM logic is shared, and how the new evaluation measures contribution is made transparent. Confirming there are no hidden criteria is key to adoption."
Joda took notes. "Data capture and evaluation design can't be separated. They have to advance together."
Chapter Four: The Day Workers Stopped Stepping Away From Work
Nine months later, a report arrived from Joda.
After AI cameras launched, tablet round trips disappeared entirely. Workers concentrated on the step; data accumulated automatically. "With travel time gone, each worker gained 50 minutes of actual work time per day," Joda wrote.
Inspection misses also dropped sharply. AI cameras flagged suspicious products in first-pass judgment; inspectors focused on flagged items. Field-flowed defects fell 68% four months after launch. "Instead of humans inspecting everything, machines inspect everything and humans inspect the priority cases. The structure changed," the report said.
The largest change appeared in evaluation acceptance. With per-axis RFM scores disclosed individually, workers came to recognize their own strengths and weaknesses. "An evaluation system where you can see what you're being evaluated on. Unfairness perception dropped substantially," Joda wrote.
Treatment of high performers also improved. Once contribution was visible through data, previously-hidden high contributors surfaced. "Among veteran workers, some scored overwhelmingly on the Monetary axis—lowest defect rate. They hadn't been noticed before," the report said.
The development process became individually optimized. Low-Recency workers got stability training; low-Frequency workers got multi-skilling; low-Monetary workers got quality-awareness training. "The era of giving everyone the same training ended," Joda wrote.
As a side effect, accumulated AI camera data also fed line-improvement discussions. Where variability was largest, which workers had optimized—these became visible, and line-design review conversations began. "Data collected to evaluate people turned out to be usable for line improvement," the report said.
Attrition fell. With improved evaluation fairness, intent-to-leave dropped substantially among junior workers. "A survey result emerged saying 'I feel my effort is being correctly evaluated,'" Joda wrote.
The final line of the report read: "Automating data capture was a means. The essence was redesigning what we measure. The moment we designed three axes with RFM, worker contribution became visible in three dimensions. Quality of evaluation is determined more by how data is used than by data accuracy."
The day workers who used to walk to the tablet stopped stepping away from work, what became visible was more than productivity, the report said.
"Managing work performance doesn't end at capturing data. What you measure determines the quality of evaluation. RFM asks for multi-dimensional measurement of contribution through Recency, Frequency, and Monetary. A single metric drives behavior optimized to that one axis; three axes evaluate stability, volume, and quality together. In a factory where workers walked to a tablet, the day AI cameras eliminated entry, what changed wasn't the capture method but the evaluation itself."
Related Files
Tools Used
- ROI Polygraph — Visualizing entry round-trip loss, subjective-data cost, and inspection miss cost
- ROI Proposal Generator — Payback simulation for AI camera plus RFM evaluation introduction


