ROI Case File No.533: 'Once Everything Is in Place' Never Came

"Once Everything Is in Place" Never Came
Chapter 1: While We Waited for the Perfect Platform, the Data Grew Stale
"We want to cross-reference product data and market data and automate listing and charting. We're looking for a way to analyze with AI."
Satomi Uzawa, the data-utilization manager at DataFusion, spoke while showing her screen. "We've got Tableau as a BI tool. But the data is scattered across multiple databases and we haven't unified it. We can't meet the floor's fine-grained requests, either."
"How do you analyze now?" Claude asked.
"By hand," Uzawa answered. "We gather from databases here and there, turn it into CSV, attach it to ChatGPT, and have it analyze. Reading from Box and OneDrive is hit-or-miss too, and filtering is manual. A single analysis can take half a day."
"Why haven't you moved to a system before now?" I confirmed.
"We thought, 'once everything is in place,'" Uzawa answered. "We'd build the perfect data platform first, then start analyzing. But that 'everything in place' day never comes. While we deliberate, the data and the market grow stale. We've secured part of the budget, and we'd consider an additional request for a good proposal."
"Rather than waiting for perfection, you should start small and grow it," I responded. "Let's design it with MVP."
Chapter 2: MVP Asks Where the Minimum That Delivers Value Is
"This case needs MVP."
Claude wrote "MVP" on the whiteboard.
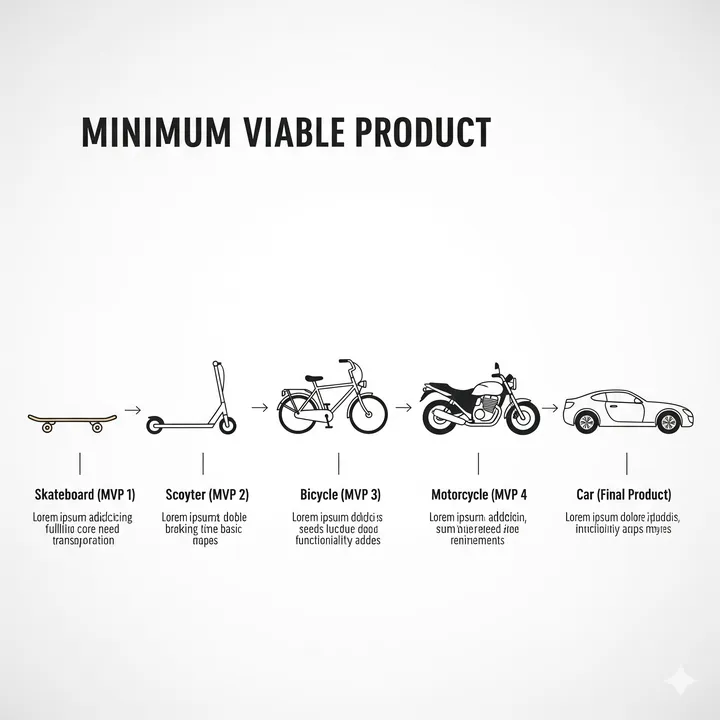
"MVP—a Minimum Viable Product—is the idea of first building the smallest configuration that can verify value, then growing it as you use it," I explained. "It's a core concept of lean startup, but it works for internal systems too. Wait for 'everything in place' and you never start. Carve out the smallest range that delivers value, move it first, and expand while watching the effect. It's a tool for going the opposite way of perfectionism."
"Let's measure the current cost first," Gemini said, opening ROI Polygraph and entering the data Uzawa had provided.
"The monthly data-analysis cost is in," Gemini read out. "Manual collection and integration from scattered databases averages 210 hours a month; at ¥4,300 an hour, that's ¥903,000 a month. Manual aggregation and charting averages ¥550,000 a month. Re-analysis from data inconsistency averages ¥480,000 a month. Opportunity loss from delayed product-development decisions averages ¥700,000 a month. The expected value of key-person risk in analysis know-how averages ¥450,000 a month. The total is ¥3,083,000 a month—roughly ¥37 million a year."
Uzawa stared at the figures. "I thought it was only the labor of collecting data. Add the opportunity loss from delayed decisions, and this is how much we lose while we wait."
"Then let's design it with MVP," I continued.
[Carving Out the Minimum Range—Where Does Value Come From]
"First, we carve out the smallest range that delivers value," Claude said. "Without waiting to integrate all data, we first unify just the two streams used most—product data and market data. We narrow to the highest-frequency analysis: listing and charting for product development. Not everything—we start where it works."
[The Minimum Data Base—Aggregate Only What You Use]
"Next, we build the minimum data base," Gemini continued. "Rather than standing up a company-wide data lake at once, we start from a base that aggregates the two target streams. The filtering that raises read accuracy from Box and OneDrive, too, is implemented narrowed to this range. Build it small, and it moves fast."
[Implementing the AI Analysis Tool—Make It Something the Floor Can Touch]
"We load AI analysis onto the aggregated data," I continued. "We automate the work where the analyst attached CSVs by hand, and implement automatic data analysis and charting. We make an interface anyone can operate without specialist knowledge. Even at the MVP stage, the key is to make it something the floor can actually use."
[Measure and Expand—Grow It as You Use It]
"Finally, we use it, measure, and expand," Claude continued. "We measure whether the minimum configuration actually delivers effect. If it works, add target data and analysis features. If it doesn't, revisit the range. Rather than building the perfect platform at once, we grow it stage by stage while confirming value."
[Estimating the Payback]
"Let's run the numbers with ROI Proposal Generator," Gemini proposed.
- Initial cost: minimum data base build, AI analysis tool development, automating CSV attachment and filtering, and on-site training—¥7.2 million total
- Monthly cost: base operation and ongoing model updates combined—¥240,000 a month
- Monthly savings: data-integration hours cut = ¥720,000 a month (assuming 80% reduction); aggregation and charting cut = ¥440,000 a month; re-analysis cut = ¥380,000 a month; decision delays resolved = ¥420,000 a month—¥1,960,000 a month total
- Net monthly savings: ¥1,960,000 − ¥240,000 = ¥1,720,000 a month
- Payback period: ¥7.2 million ÷ ¥1,720,000 = about 4.2 months
"Payback in just over four months," Gemini summarized. "What makes it work is not waiting to integrate all data. By narrowing to the two most-used streams and starting minimal, value comes early and payback starts early. The opportunity loss while waiting for 'everything in place' was the biggest cost of all."
Uzawa said as she checked the figures, "I kept thinking, 'after we build the perfect platform.' I had no notion of starting minimal and growing it. The waiting time itself was the loss."
"MVP is a tool for stopping the hand that waits for perfection and getting you moving with the minimum," I responded.
Chapter 3: A Rollout Plan That Grows from the Minimum
"Let me lay out the approach," I said, standing at the whiteboard.
"Month one—identify the two most-used data streams and fix the minimum range. Months two and three—build the minimum data base and aggregate product and market data. Month four—implement the AI analysis tool and provide listing and charting. Month five—pilot on the floor and measure the effect. Month six—decide on expanding target data and analysis features. Month seven onward—expand the targets stage by stage while watching usage, growing toward a data lake."
"Will starting from the minimum really be useful?" Uzawa confirmed.
"It will," Claude responded. "Even at minimum configuration, automate the most-used analysis and the half-day of manual work vanishes immediately. Because you can confirm value early, the budget for expansion is easier to pass. Far safer to try small and confirm than to build the perfect platform and only then realize it's unusable."
Uzawa said as she took notes, "Just knowing we don't have to wait for everything to be in place—I feel like we can move."
Chapter 4: The Day the Floor That Stopped Waiting Started Moving
Nine months later, a report arrived from Uzawa.
Three months after the minimum base went live, manual data integration was down 80% versus before. "The work of gathering from here and there into CSV became almost automatic. Analysis that took half a day finishes in dozens of minutes," Uzawa wrote.
Re-analysis dropped sharply too. Unifying the data resolved inconsistencies, and the rework of 'the data we gathered doesn't match' disappeared. "The premise of analyzing while doubting the data is gone," the report said.
The biggest change showed up in decision speed. The analysis product development needed came out instantly, and judgments quickened. "We can analyze before the market data grows stale. Missing opportunities while we wait is over," Uzawa wrote.
Expansion proceeded as planned, too. Because they confirmed effect at minimum configuration before adding target data, investment judgment was smooth. "We could confirm 'this works' in numbers, so the additional budget passed easily. Had we built large from the start, it wouldn't have gone this way," the report said.
As a side effect, the floor's analysis literacy rose. Making it a tool anyone could touch meant analysis stopped being one person's job. "Analysis went from my solo task to the team's shared work. The key-person dependency dissolved," Uzawa wrote.
At the end of Uzawa's report, she had written this: "Waiting for the perfect platform was the same as looking for a reason not to move. The moment we carved out the minimum range with MVP, the first step was decided. Move with the minimum and grow it—it's far faster than waiting for perfection."
The day a floor that kept waiting for "everything in place" became one that starts minimal and grows, data analysis had turned from a plan that waits for perfection into a practice that polishes while moving, the report read.
"Floors where DX never advances share a common trap: the perfectionism of 'start once everything is in place.' While they wait for the perfect data platform, the data and the market grow stale. What MVP asks is where the minimum that delivers value is. Don't build everything at once—carve out the range that works most, move it, and grow it as you use it. The day a company where 'once everything is in place' never came started moving from the minimum, what changed was not the scale of the analysis system but the very judgment that stops waiting for perfection and begins."
Related Files
Tools Used
- ROI Polygraph — Visualizing data-integration hours, re-analysis, and the opportunity loss of delayed decisions
- ROI Proposal Generator — Payback simulation for an AI analysis base starting from a minimum configuration


