
ROI Case File No.582: They Listed the Features They Wanted, but Never Measured What Would Come Back

They Listed the Features They Wanted, but Never Measured What Would Come Back
Chapter 1: They Know the Shape They Want, but Nothing Decides It
"We're looking for a company that can build us a data management system connected to our core system."
Osamu Kaida, IT department manager at GlobalBox, said this as he laid out the situation. A corrugated cardboard manufacturer. "Our core system is Dansys Answer. The trouble is it doesn't support API integration. Everything moves by CSV. We're afraid of communication outages and network cutoffs with the cloud, so we want to build on-premises. There's a core-system server refresh a few years out, and we're assuming full deployment lines up with that."
"Where does it hurt most right now?" Claude asked.
"Version control," Kaida answered. "Design data and CAD data just sit in folders, and no one can tell which is the latest. There are times we've made a revision and then printed with the old design anyway. Our internal checks catch it, but that means a human is standing there stopping it. And the core system has nowhere to put customer information or quality requirements."
"I've also looked into the convenient apps you see at trade shows," Kaida continued. "The problem is we only need some of the functions, but taking the whole package is expensive. The features we need are listed out on paper."
"Have you measured how much comes back if you put those features in?" I confirmed.
"...We haven't," Kaida answered. "All I've done is list the features I want. How much a revision mistake costs. How much time it takes to hunt down the latest version. I've never counted what comes back."
"Listing what you want doesn't decide whether an investment is good or bad," I replied. "Let's break this down with ROI."
Chapter 2: ROI Asks—Set What You Pour In Against What Comes Back
"This case calls for ROI."
Claude wrote "Investment / Return" on the whiteboard.
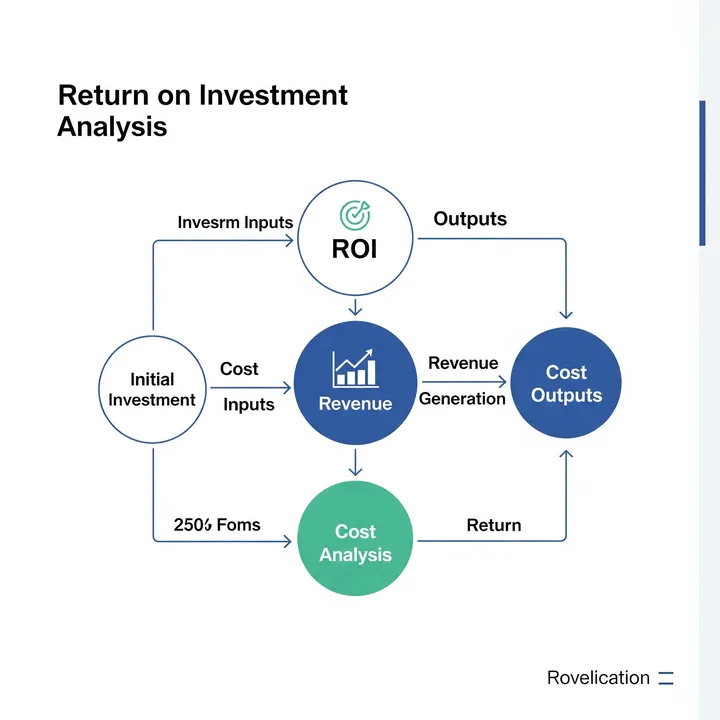
"ROI—return on investment—is a framework for putting the amount you pour in and the amount that comes back on the same scale and judging by the ratio," I explained. "The essence is not stopping at a feature list. Lining up the features you need says nothing about whether it's expensive or cheap. Only once you convert the return into money can you say whether that feature is needed. Full deployment or partial—the ratio decides that too."
"First, let's measure the current cost," Gemini said, opening ROI Polygraph. The data Kaida provided went in.
"The monthly costs are out," Gemini read off. "Hunting down and cross-checking the latest design and CAD data averages 165 hours per month; at ¥3,800 per hour, that's ¥627,000 per month. Losses from reprinting and scrapping due to revision errors average ¥420,000 per month. Back-and-forth confirmation caused by having nowhere to record customer information and quality requirements averages ¥340,000 per month. Visual cross-checking that relies on internal review averages ¥300,000 per month. The risk of over-investment from swallowing a high-priced full-deployment proposal averages ¥360,000 per month. The total is ¥2,047,000 per month. Annualized, roughly ¥24,560,000."
Kaida stared at the figures. "I was only looking at the loss from using the wrong version. Once you add the time spent searching and the confirmation loops, it comes to this much."
"Then let's design with ROI," I continued.
[Investment—Count everything you pour in, hiding nothing]
"First, the investment," Claude said. "On-premises server hardware, build cost, CSV integration implementation, data migration, operational effort. Count the migration and operation that tend not to appear on the quote. Underestimate, and the ratio goes crooked."
[Return—Convert what comes back into money]
"Next, the return," Gemini continued. "Time spent hunting the latest version, reprinting from revision errors, the labor of visual checking. As grievances, they can't be added up. Convert them into hours, sheet counts, and unit prices, and you get how much comes back per month. Only at that point do they line up against the investment."
[Ratio—Work out the return feature by feature]
"After the return, the ratio," I continued. "The trade-show app is expensive as a whole. But calculate the return per feature and you can see whether version control and customer-information recording alone pay for it. Full package or partial isn't a matter of taste—the ratio decides."
[Timing—Invest in step with the server refresh]
"Last, timing," Claude continued. "The same investment, overlapped with the core-system server refresh, means hardware and migration costs are paid once instead of twice. Separate the portion that waits for the refresh a few years out from the portion that starts now. Just shifting the timing changes the ratio."
[Calculating the payback]
"Let's run the numbers with ROI Proposal Generator," Gemini proposed.
- Initial cost: Requirements definition, on-premises hardware, data management system build, CSV integration implementation, version control design, and data migration — ¥4,700,000 total
- Monthly cost: Server maintenance plus ongoing system operation — ¥220,000 per month
- Monthly savings: Elimination of latest-version searching and cross-checking = ¥440,000 per month (assuming a 70% reduction), prevention of reprinting from revision errors = ¥340,000 per month, elimination of confirmation loops through centralized customer information and quality requirements = ¥260,000 per month, reduced visual checking = ¥240,000 per month — ¥1,280,000 per month in total
- Net monthly savings: ¥1,280,000 − ¥220,000 = ¥1,060,000 per month
- Payback period: ¥4,700,000 ÷ ¥1,060,000 = approximately 4.4 months
"A payback of just over four months," Gemini summarized. "What makes it work is dropping the list of wanted features and converting the return into money. As a list, expensive or cheap is only an impression. Because the ratio exists, you can decline full deployment and pick only the features you need. The investment doesn't swing at air."
Kaida looked over the figures. "I thought identifying the necessary features would settle it. Without the return, you can't even say what's expensive."
"ROI is a tool for putting what you pour in and what comes back on the same scale," I replied.
Chapter 3: An Implementation Plan Decided by the Ratio
"Let me lay out how to proceed," I said, standing at the whiteboard.
"Month one—inventory current operations and measure what comes back. Month two—calculate return on investment per feature and fix the implementation scope. Months three and four—build the on-premises environment and implement version control. Month five—CSV integration with the core system and migration of customer information and quality requirements. Month six—trial operation and effect verification. Month seven onward—full rollout timed to the server refresh, and re-measurement of the ratio."
"Wouldn't putting in every feature we need be the safe move?" Kaida asked.
"It reliably makes it expensive," Claude replied. "Put everything in and the investment swells while the low-return features drag the ratio down. Narrow to the high-return items like version control and you recover quickly on a small investment, which funds the next one. Measuring the ratio comes before counting features."
Kaida took notes. "Before listing the features I want, measure what comes back. I can see the order now."
Chapter 4: The Day the Return Became Visible and They Could Decide
Ten months later, a report arrived from Kaida.
Version control changed dramatically once the system went live. "Opening folders and comparing timestamps to find the latest version is gone. The system points to the latest, so there's nothing to be confused about," Kaida wrote.
Revision errors stopped as well. Production from an old version now gets blocked by the mechanism itself. "Old versions don't circulate in the first place, before internal review catches them. The loss from reprinting is gone," the report said.
The largest change showed up in how they decided on investments. From listing wanted features, they moved to choosing by the return. "I used to carry around a list of required features. Once we converted it to money, what to buy and what to decline was decided instantly," Kaida wrote.
The on-premises choice was backed by numbers, too. Pricing the outage risk let it be explained within the ratio. "A configuration we chose because it scared us can now be explained by what it returns," the report said.
As a secondary effect, their view of proposals changed. They could now counter full-deployment quotes with the ratio. "We stopped accepting 'this much for the whole set' at face value. Now we ask back: how much does this feature return?" Kaida wrote.
At the end of Kaida's report, he had written: "I thought the data management problem was that we couldn't find a good system. But the real problem was that we listed the features we wanted and never measured what would come back. The moment ROI put what we pour in beside what comes back, what to buy and what to decline was decided. Before listing features, measuring the return came first."
The day a company that had listed features without measuring the return became a company that decides investment by the ratio, building a data management system had changed from filling out a feature list into a design that puts what you pour in and what comes back on the same scale, the report noted.
"System-build consultations almost always arrive in the form of 'we want these features.' But before you list features, there is something to ask. If you put it in, how much comes back? What ROI asks about is the amount you pour in, the amount that comes back, and the ratio between them. Convert it to money and what to buy and what to decline separate on their own. The day a company that had been listing features managed to measure the return, what changed was not the system specification but the very perspective of setting what you pour in against what comes back."
Related Files
Tools Used
- ROI Polygraph — Visualizing latest-version search hours, reprinting losses from revision errors, and confirmation loops
- ROI Proposal Generator — Investment-recovery simulation for an on-premises data management system build driven by setting what you pour in against what comes back


