
ROI Case File No.598: They Tried to Draw a Ten-Year Picture, but Couldn't See the Week They Were In

They Tried to Draw a Ten-Year Picture, but Couldn't See the Week They Were In
Chapter 1: They Want a Roadmap, but the Work Keeps Stalling
"I'd like to consult you about visualizing our business workflows."
Shu Kokuta, DX promotion manager at Global Property Solutions, said this as he laid out the situation. The company manages rental property. "We've been directed to build a roadmap looking five to ten years ahead. To do that, I believe we first have to inventory and visualize every workflow in the company."
"How far has the inventory gotten?" Claude asked.
"Six months in, we're at thirty percent," Kokuta answered. "We interview each department and draw the diagrams, but exceptions surface as we write. This property alone is different, this management company follows a separate procedure, the flow changes in peak season. Every addition swells the diagram and the end recedes. Meanwhile, the procedures of the department we mapped first have already changed."
"Are you proceeding on the premise that it can't be used until it's complete?" I confirmed.
"...Yes," Kokuta answered. "I assumed we'd build the roadmap after drawing everything. I've never looked at what happens in a single week, in short intervals."
"On the premise of finishing before using, it goes stale before it's finished," I replied. "Let's break this down with AGILE DEVELOPMENT."
Chapter 2: AGILE DEVELOPMENT Asks—Cut It Short and Iterate
"This case calls for AGILE DEVELOPMENT."
Claude wrote "Short intervals / Working output / Show and correct" on the whiteboard.
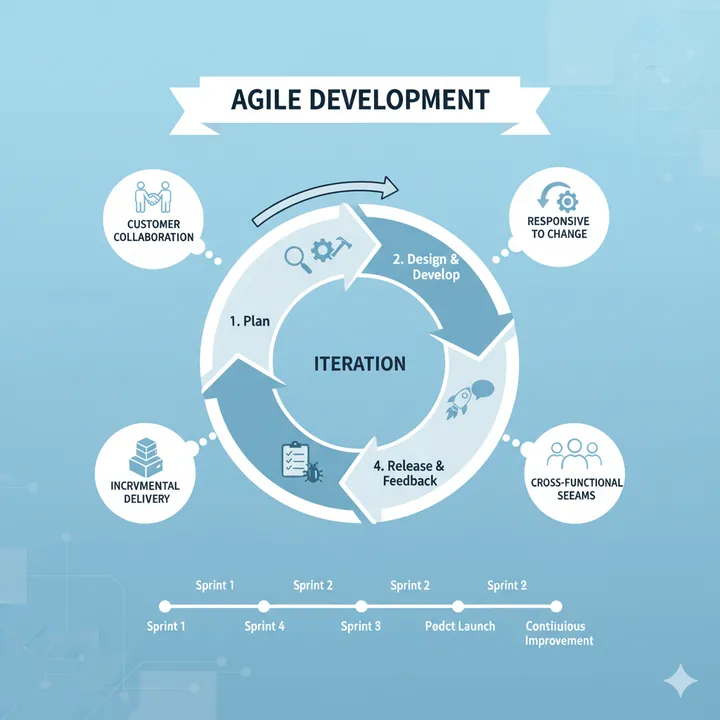
"AGILE DEVELOPMENT is a framework that avoids building one long plan, ships something working in short periods, and advances by showing it and correcting it," I explained. "The crux is not waiting for completion. Workflow diagrams are the same: rather than drawing the whole company before using any of it, draw one department's worth in two weeks and show it to the floor for correction. Every iteration raises the accuracy, and it's usable partway through. The ten-year picture becomes drawable only once you can draw the week you're in."
"First, let's measure the current cost," Gemini said, opening ROI Polygraph. The data Kokuta had provided went in.
"The monthly cost is out," Gemini read off. "Labor for interviewing, drawing, and revising workflow diagrams averages 165 hours a month; at ¥4,000 an hour, that's ¥660,000 a month. Duplicated handover and training, because procedures aren't visualized, averages ¥400,000 a month. Duplicated work and confirmation back-and-forth at handoffs between departments averages ¥360,000 a month. Stalled DX investment decisions, because the visualization never completes, average ¥340,000 a month. Delayed responses caused by an inability to grasp personalized exception handling averages ¥300,000 a month. Total: ¥2,060,000 a month. Annualized, roughly ¥24,720,000."
Kokuta stared at the figures. "I was only looking at the drawing burden. Once you add re-teaching at every handover and the decisions sitting frozen, it comes to this much."
"Then let's design it with AGILE DEVELOPMENT," I continued.
[Short intervals—decide the scope for two weeks]
"First, short intervals," Claude said. "Don't take on the whole company at once. In two weeks, draw one process only—say, from rental application to contract. Cut the scope and the exceptions can't expand without limit. Splitting into units that have an end comes first."
[Working output—ship it in a usable form]
"Next, working output," Gemini continued. "At the end of the two weeks, produce that process's diagram and a list of the duplications found within it. Not a finished product—something usable at that point. Even if the diagram is thirty percent, the duplications you found can be fixed immediately."
[Show and correct—hold it up to the floor and take out the gaps]
"After working output comes showing and correcting," I continued. "Show the diagram you drew to the people who do that work. The places where they say 'that's wrong' are the real procedure. Using a diagram as a draft surfaces exceptions faster than interviewing in a meeting room. Think of it as drawing in order to remove the gaps."
[Stack in order—let the results decide the next two weeks]
"Last, stacking in order," Claude continued. "Draw next from beside the process where the interval you just finished found the largest duplication. Don't fix the whole order in advance. Each iteration reveals where to draw next."
[Simulating the investment recovery]
"Let's run the numbers with ROI Proposal Generator," Gemini proposed.
- Initial cost: Designing the visualization approach, setting up the workflow-management base, standing up the two-week iteration cycle, implementing improvements to duplicated work, and internal rollout—¥4,800,000 in total
- Monthly cost: Platform usage plus ongoing operation and maintenance—¥220,000 a month
- Monthly savings: Reduced interviewing, drawing, and revision labor = ¥460,000 a month (assuming a 70% reduction), elimination of duplicated handover and training = ¥320,000 a month, elimination of duplicated work and confirmation back-and-forth between departments = ¥280,000 a month, resolution of stalled investment decisions = ¥260,000 a month—¥1,320,000 a month in total
- Net monthly savings: ¥1,320,000 − ¥220,000 = ¥1,100,000 a month
- Payback period: ¥4,800,000 ÷ ¥1,100,000 = approximately 4.4 months
"That's a payback of a little over four months," Gemini summarized. "What works is that you stop finishing before using, and iterate in short intervals. Draw the whole company at once and it goes stale before completion, and ends without ever being used. Because usable results come out every two weeks, it works partway through. The investment doesn't swing at air."
Kokuta looked over the numbers. "I assumed we'd think after drawing the whole picture. Without cutting it short, it goes stale before we finish drawing."
"AGILE DEVELOPMENT is a tool for cutting things short and iterating," I replied.
Chapter 3: A Deployment Plan That Cuts Short and Iterates
"Let me lay out the approach," I said, standing at the whiteboard.
"Month one—design the units of work and stand up the two-week interval. Month two—visualize rental application through contract and surface the duplications. Months three and four—iterate in order through move-out settlement, restoration, and payment management. Month five—implement improvements to the duplications found. Month six—verify results for the range drawn and revise the priorities. Month seven onward—continue iterating and feed it into the five-to-ten-year roadmap."
"The roadmap is a five-to-ten-year matter. Can two-week units reach that far?" Kokuta confirmed.
"If you can't draw the week you're in, you can't draw ten years out," Claude replied. "The picture five years ahead only gains grounding once you know where the current procedures duplicate and where they're stuck to individuals. Every iteration piles up that material. Conversely, wait for a complete company-wide diagram and starting the roadmap itself gets pushed two years out. Accumulating the near reality comes before drawing the distant picture."
Kokuta took notes as he spoke. "Iterate two weeks before drawing ten years. I can see the sequence now."
Chapter 4: The Day Short Iterations Made the Picture Drawable
Ten months later, a report arrived from Kokuta.
The visualization, stuck for six months, started moving. "Once we shaped it as finishing one process every two weeks, ten months covered nearly all the major workflows. Thirty percent in six months got turned on its head," Kokuta wrote.
Duplications disappeared while the drawing was underway. They could act without waiting for completion. "In the second week of drawing the rental-application diagram, we found three departments performing the same confirmation. We cut it to one within that month," the report said.
The largest change showed up in how plans were made. A state of using it after completion became a state of using the partial results. "We were stuck on 'once everything is assembled.' Now we move on what this week's portion revealed," Kokuta wrote.
Cooperation from the floor got easier too. Bringing a diagram beat asking questions. "Ask with a blank sheet and people brace themselves. Bring a wrong diagram and they say 'that's not right' and fix it for you. We gathered three times as much in the same time," the report said.
As a side effect, the roadmap gained grounding. The accumulated reality became the material directly. "We didn't have to draw the five-year picture from imagination. We can write it based on where people are actually stuck today," Kokuta wrote.
The final line of Kokuta's report read: "I thought the trouble with visualization was that our operations were too complex. But the real problem was that we tried to draw a ten-year picture while unable to see the week we were in. The moment we cut it short with AGILE DEVELOPMENT, results usable partway through started appearing. Before drawing the whole, iterating two weeks came first."
The day a company that tried to draw a ten-year picture became a company that could cut short and iterate, workflow visualization had changed from producing a finished map into a design that ships working output in short intervals and corrects it, the report noted.
"Consultations about visualization usually arrive in the form of 'we want to inventory the whole thing first.' But there is a question to ask before drawing. Is it truly unusable until the drawing is done? What AGILE DEVELOPMENT asks is short intervals, working output, and showing and correcting. Ship in two weeks and it works partway through, and the floor corrects it for you. The day a company that waited for completion could iterate short, what changed was not the complexity of the operations but the very perspective of using the results along the way."
Related Files
Tools Used
- ROI Polygraph — Visualizing interviewing and drawing labor, duplicated handover training, cross-department confirmation back-and-forth, and stalled investment decisions
- ROI Proposal Generator — Investment-recovery simulation for workflow visualization and DX promotion built from iteration in short intervals


