
ROI Case File No.599: They Said They Wanted to Track Visits, but Never Looked at Where the Intent Broke

They Said They Wanted to Track Visits, but Never Looked at Where the Intent Broke
Chapter 1: They Want to Track Purchases, but Can't Settle on How to Measure
"We want to build our own web-advertising measurement tool that can track all the way to purchase."
Satoru Danbashi, planning department manager at NexMark, said this as he laid out the situation. The company is a regionally focused marketing firm. "We propose display advertising to clients using phone numbers as audience data. But online and offline are severed, so we can't trace whether someone actually visited the store or bought anything."
"Are the existing measurement tools not enough?" Claude asked.
"Their accuracy on store-visit contribution is poor," Danbashi answered. "We can estimate from location data, but it isn't solid enough to explain to a client. So we want to build a mechanism in-house that tracks all the way to purchase. We're looking for an outside partner who can build it in three to six months."
"Do you look at which stage the people who saw the ad drop off at?" I confirmed.
"...We don't," Danbashi answered. "All we've thought about is capturing the final purchase. They see the ad, take an interest, decide they want to go, remember it, and visit. Where along that does it break? We've never looked at it in stages."
"Chase only the last point and you still can't tell what to fix," I replied. "Let's break this down with AIDMA."
Chapter 2: AIDMA Asks—Split Attention Through Action Into Stages
"This case calls for AIDMA."
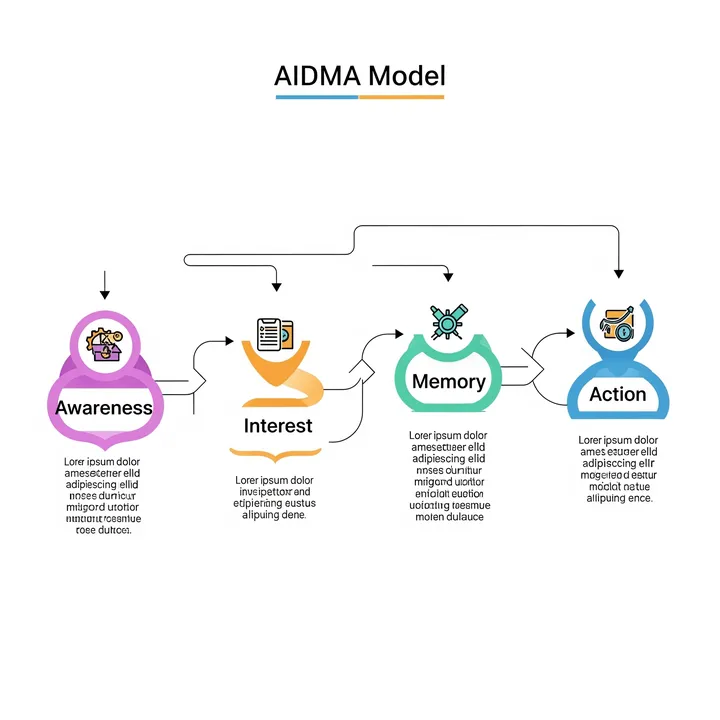
Claude wrote "Attention / Interest / Desire / Memory / Action" on the whiteboard.
"AIDMA is a framework that divides the path from encountering an ad to buying into five stages and shows where people drop away," I explained. "The crux is not looking only at the entrance and the exit. Connect ad impressions to store visits as two points and you can't tell what happened in between, so there's nothing to improve. Measure by stage, and where the intent breaks can be named. The shape of the measurement tool you should build is decided from there too."
"First, let's measure the current cost," Gemini said, opening ROI Polygraph. The data Danbashi had provided went in.
"The monthly cost is out," Gemini read off. "Labor for producing advertising reports and manually reconciling data averages 170 hours a month; at ¥3,900 an hour, that's ¥663,000 a month. Lost renewals because performance can't be explained average ¥440,000 a month. Excessive ad-spend allocation caused by poor accuracy on store-visit contribution averages ¥360,000 a month. Stalled analysis, because online and offline data are severed, averages ¥340,000 a month. Price erosion from insufficient evidence behind improvement proposals averages ¥300,000 a month. Total: ¥2,103,000 a month. Annualized, roughly ¥25,240,000."
Danbashi stared at the figures. "I was only looking at the reporting burden. Once you add the contracts cut because we couldn't explain results, and the discounts given for lack of evidence, it comes to this much."
"Then let's design it with AIDMA," I continued.
[Attention and interest—separate seen from touched]
"First, attention and interest," Claude said. "An ad being served and an ad being noticed are different things. Impressions, viewable impressions, and clicks. Up to here, the current setup can already capture it. Start by lining up, as stages, the numbers you already have and never use."
[Desire—pick up the traces of wanting to go]
"Next, desire," Gemini continued. "Opened the map, checked opening hours, tapped the phone number, saved a coupon. These are traces of wanting to go. They lie on the path everyone takes before purchase, and they're measurable. Capture them and you gain a stage more reliable than estimating a store visit."
[Memory—measure the interval between the day seen and the day visited]
"After desire comes memory," I continued. "There's a gap between the day someone sees the ad and the day they visit. Some come the same day, some two weeks later. Without measuring that interval you underestimate the ad's effect and switch off campaigns that are working. The memory stage is the design of the measurement window itself."
[Action—connect visits and purchases with a confidence level]
"Last, action," Claude continued. "Matching by phone number, coupon presentation, membership lookup at the store. Confidence differs by method, so don't assert—attach a confidence level. Rather than trying to connect everything with certainty, if the drop-off by stage is visible, the place to fix is clear."
[Simulating the investment recovery]
"Let's run the numbers with ROI Proposal Generator," Gemini proposed.
- Initial cost: Measurement design and per-stage metric definitions, developing the measurement tool, integrating with the ad-delivery platform, implementing offline data matching, and building automated report generation—¥5,000,000 in total
- Monthly cost: System usage plus ongoing data-integration operation—¥230,000 a month
- Monthly savings: Automation of report production and reconciliation = ¥460,000 a month (assuming a 70% reduction), retention of renewals through explainable performance = ¥360,000 a month, optimization of ad-spend allocation = ¥280,000 a month, price maintenance through evidence behind improvement proposals = ¥240,000 a month—¥1,340,000 a month in total
- Net monthly savings: ¥1,340,000 − ¥230,000 = ¥1,110,000 a month
- Payback period: ¥5,000,000 ÷ ¥1,110,000 = approximately 4.5 months
"That's a payback of four and a half months," Gemini summarized. "What works is that you don't try to capture the single point of purchase perfectly—you split into stages. A mechanism that chases only the last point is heavy to build and still doesn't land. Make the drop-off visible by stage, and you can say what to fix. The investment doesn't swing at air."
Danbashi looked over the numbers. "I thought capturing the purchase was enough. Without splitting into stages, you can't even say what to fix."
"AIDMA is a tool for splitting attention through action into stages and measuring them," I replied.
Chapter 3: A Deployment Plan That Measures by Stage
"Let me lay out the approach," I said, standing at the whiteboard.
"Month one—define metrics for each of the five stages and take stock of the numbers already available. Month two—implement measurement of the desire stage and integrate with the ad-delivery platform. Months three and four—measure the memory stage and analyze the interval to store visit. Month five—implement phone-number matching for visits and purchases. Month six—automate per-stage reporting and verify results. Month seven onward—refine the confidence levels and extend the metrics by client industry."
"What clients want is to be able to track purchases. Will they accept a story about stages?" Danbashi confirmed.
"Give them purchases alone and you still can't say what to do next," Claude replied. "A report saying there were ten visits offers no move for increasing them. Show that clicks are high but the map isn't being opened, and it becomes a conversation about fixing the landing page rather than the ad copy. Being able to point to the place to fix, rather than handing over numbers, is the reason they keep you."
Danbashi took notes as he spoke. "Look at where it breaks before chasing purchases. I can see the sequence now."
Chapter 4: The Day the Stages Became Visible and the Proposals Changed
Ten months later, a report arrived from Danbashi.
Report production changed dramatically through automation. "The work of gathering numbers from several dashboards and pasting them into a table is gone. The first three days of the month opened up entirely," Danbashi wrote.
Drop-off by stage became visible too. Where things broke turned out to differ by client. "A store where ads are clicked but the map is never opened and a store where the map is opened but nobody comes need completely different fixes. Distributing the same proposal to both was the mistake," the report said.
The largest change showed up in how proposals were made. A state of reporting results became a state of pointing to the place to fix. "We used to stop at 'this month there were this many.' Now we can write that it breaks here, so next we'll do this," Danbashi wrote.
Retention rose as well. Improvement proposals with grounds led to renewals. "We were being cut because we couldn't explain performance. Show it by stage and the reason to continue comes from their side," the report said.
As a side effect, the development scope shrank. They stopped trying to connect everything perfectly. "Quoted as 'complete tracking through to purchase,' it was a year of work. Split into stages, we shipped in under six months," Danbashi wrote.
The final line of Danbashi's report read: "I thought the trouble with ad measurement was that online and offline were severed. But the real problem was that we said we wanted to track visits and never looked at where the intent broke. The moment we split into stages with AIDMA, both the place to measure and the place to fix were decided. Before chasing purchases, splitting the stages came first."
The day a company that never looked at where intent broke became a company that could measure and fix by stage, advertising measurement had changed from single-point purchase tracking into a design that splits attention through action into stages and watches the drop-off, the report noted.
"Consultations about ad measurement usually arrive in the form of 'we want to track through to purchase.' But there is a question to ask before you start tracking. Have you looked at where the intent breaks? What AIDMA asks is attention, interest, desire, memory, and action. Split into stages, and the place where people are dropping away can be named and a fix can be offered. The day a company that chased only the last point could split the stages, what changed was not the precision of the measurement but the very perspective of watching the drop-off along the way."
Related Files
Tools Used
- ROI Polygraph — Visualizing report-production labor, lost deals from unexplainable performance, and inefficient ad-spend allocation
- ROI Proposal Generator — Investment-recovery simulation for web-advertising measurement tool development built from breaking attention through action into stages


